Standing Up to Attacks on Public Higher Education


Click here to read Standing Up to Attacks on Public Higher Education
Click here to read Erosion of Tenure at the University of Cincinnati 1998-99 to 2016-17 Part I
Click here to read Kiss Me, I’m Union
On February 26, arguments were made before the Supreme Court in the case Janus v AFSCME. Ostensibly this case concerns freedom of speech, but the clear goal of the groups behind this and many other cases like it is to weaken union power in our society. Billionaire-sponsored groups like the Bradley Foundation and the Koch brothers’ Americans for Prosperity are not interested in fostering individual freedom for the average hard-working person in the US. On the contrary, they are looking to damage these same individuals’ ability to protect themselves and their interests through collective action.

We need to see this case as part of a larger fight against those who want to squash not only our worker power in general but also our abilities to be effective, proper educators. The same ultra-wealthy individuals that are behind the Janus case are also advancing the increased privatization of universities, advocating for fewer restrictions of guns on campus, and directing the targeted harassment of individual university faculty members for their personal speech or academic work. Faculty at UC certainly do not share all the same values, ideas and priorities, but, as educators, we are all committed to the notion that higher educational intuitions are a positive force for our society, and that a true educational environment is one where we are free to teach, study, and research without interference from politicians or CEOs. The billionaires who have pushed cases like Janus do not share our vision of what an institution of higher education should be. For them, a university should be just another tool to advance their own interests and further entrench their own power, and us as academics are just employees expected to do the same or be removed.

It’s easy to despair when those with so much power and wealth act in such a way. But we’ve recently been provided with an amazing example in West Virginia that should give us all hope for our ability to fight back. For years, lawmakers in that state have been cutting corporate and business taxes and, subsequently, slashing funding for public schools. The state spends 11.4 percent less money per student now than it did in 2008, and its teachers are among the worst-paid in the country, ranking 48th out of 50 in average teacher salary. This year West Virginia’s educators said enough was enough. In this “right to work” state, where employees have no collective bargaining rights protected by law, teachers organized and took action. After a nine-day wildcat strike, the legislature unanimously passed a 5% raise for all teachers and school staff.

The principle of higher education as a public good, one that we all take for granted, is under threat. But the solution to this attack sits right among us.  It is us. Acting in union, we can stand up to these threats to the integrity of the work that we do and to the students and communities that depend on it. As faculty, we are the most powerful force that can defend higher education from the efforts of those who sponsored the Janus case, but we can only do so if we stand together and commit energy and action to defend our values. Together, we can demand respect for academic freedom, for our meaningful participation in shared governance of the university, and for fair due process protections for all faculty.

West Virginia’s teachers have shown us the power of standing together. We can do the same. Please check today to make sure that you are a full member of our AAUP chapter.

If you aren’t sure or if you are ready to join, contact the AAAP-UC office by emailing aaupuc1@ucmail.uc.edu or calling (513) 556-6861.

Chris Campagna
Chair, AAUP-UC Associates Council
Click here to go back to the top of the page.


Erosion of Tenure at the University of Cincinnati 1998-99 to 2016-17 Part 1
Daniel Langmeyer and Dave Rubin*

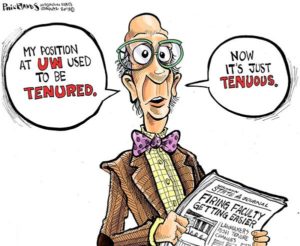
For some time, the AAUP-UC Chapter has been concerned about the status of tenure at the University. Generally, comments about what was happening to tenure were anecdotal and limited to specific departments, but the overall message was that tenure and tenure track appointments were becoming less common while non-tenure track appointments were becoming more frequent. Therefore, the AAUP felt that a study addressing the matter University-wide should be undertaken, and we provide here the findings and analysis of our study.
We divided our study into two parts. The first part deals exclusively with the relative proportions of tenure/tenure track appointments and non-tenure track appointments, and their relation to student enrollments. This article reports the results of that part of the study. We also intend to do a more detailed study on the use of adjunct faculty and hope to report on that later.

DOCUMENTATION

We examined several sources of information for this article.

First, the University annually provides the AAUP with a database that includes all members of the AAUP Bargaining Unit and, among other things, includes college, department, title/rank and salaries. We used this information, by college or school, to total the number of tenure/tenure track faculty vs. non-tenure track faculty and calculate the percentage of each. By contractual definition, Faculty Members with unqualified titles are tenured/tenure track while Faculty Members with qualified titles (Adjunct, Clinical, Educator, Field Service, Research) are non-tenure track. While we had information for each year from 1998-99 through 2016-17, we summarized only every other year feeling that would be sufficient to show overall trends as well as general timelines for major changes.

Second, we have data from the Office of Institutional Research for 2008 through 2014 which provides number of faculty by college, broken among AAUP-represented and various categories of unrepresented faculty. These data provide us with information about the relative use of Bargaining Unit faculty vs. non-Bargaining Unit faculty (unrepresented adjuncts and visitors).

Third, we also obtained from the Office of Institutional Research, for Fall Semesters 2012 through 2016, percentages of total student credit hours, by college, taught by various categories of faculty.

Fourth, we obtained Fall Semester student enrollments by headcount, credit hours taken, and FTEs for each college for 2001 through 2015. These data allow us to compare trends in faculty numbers with trends in student enrollments.

RESULTS

Table 1 provides a summary for all colleges combined (except the College of Medicine), in 2-year intervals beginning with 1998-99, of numbers and percentages of tenured/tenure-track Bargaining Unit faculty vs. non-tenure track Bargaining Unit faculty. The College of Medicine is not included because the clinicians in the COM were excluded from the Bargaining Unit beginning in 2007 and because the large number of clinicians would have greatly skewed the comparative percentages.
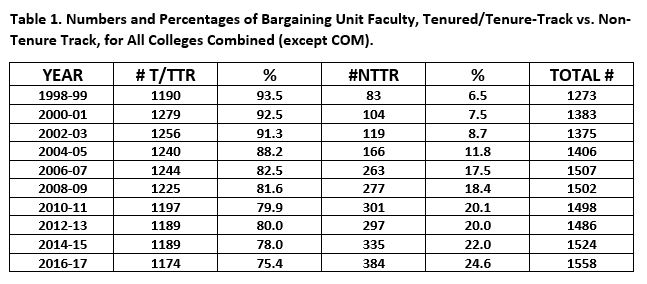
These data show a dramatic drop, from 1998-99 to 2016-17, in the percent of Bargaining Unit members that were tenured or tenure track. From 93.5% of the Bargaining Unit that was tenured/tenure track in 1998-99, that percentage fell to 75.4% in 2016-17. The decline was relatively gradual and even, except for a substantial drop of nearly 6% that occurred between 2004 and 2006, and it appears to be continuing. Actual data thus appear to substantiate the anecdotal comments that we have heard for a long time. The general erosion of tenure is clear.

Table 2 compares the relative numbers and percentages of tenured/tenure track Bargaining Unit members vs. non-tenure track Bargaining Unit members, by college, for 1998-99 and 2016-17. These data provide a more detailed view of what has transpired during this nearly 20-year span. These data make it clear that, with exception of the University Libraries, the erosion of tenure has been University-wide and across all colleges. The extent of the erosion has varied some across colleges, with greatest changes noted for the College of Nursing where the percentage of tenured/tenure track Bargaining Unit members dropped from 68.6% to 24.3% and for Professional Practice which has seen a nearly 30% drop. For the College of Nursing, we do know that a majority of Faculty Members in 1998-99 had unqualified titles while today a majority have clinical titles. In other colleges, the numbers of tenured/tenure track Faculty Members have remained almost constant or may even have increased slightly, but there has been a much faster increase in the number of Faculty Members with qualified titles, including those with Educator titles (prior to 2010, they would have had, inappropriately, Field Service titles). At the other end of the spectrum, CCM and UC-Blue Ash continue to have approximately 90% of their Bargaining Unit faculty tenured or tenure track.
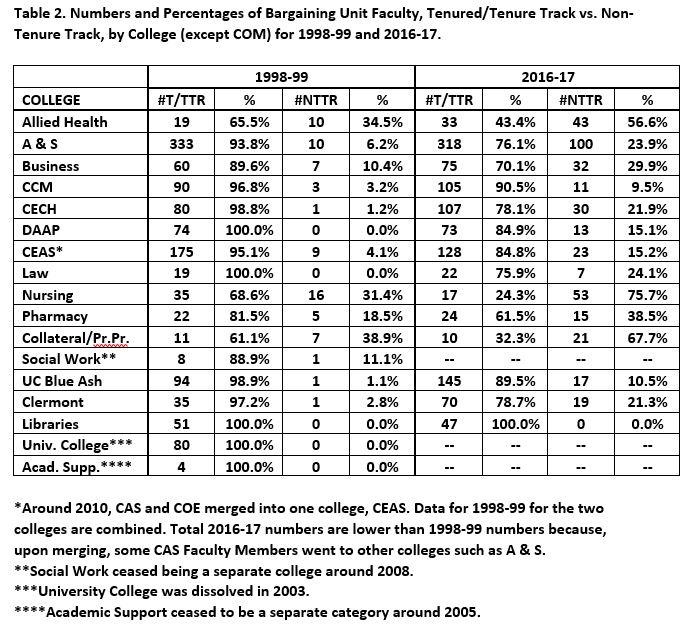
Table 3 compares student enrollment data—head count and FTEs—by college and for the total University for Autumn 2001 and Autumn 2015. During that time period, student headcount increased from 33085 to 44251, an increase of nearly 34%, and the number of student FTEs increased from 25832.4 to 34421.1, an increase of just over 33%. Over a similar time period, the numbers of tenured/tenure track Bargaining Unit members remained relatively steady—a look at those numbers in Table 1 show that number staying near 1200. In fact, that number fell from 1279 in 2000-01 to 1189 in 2014-15 at the same time that student enrollment rose by one third! Thus, the increased teaching load clearly was made up largely by increased numbers of non-tenure track Bargaining Unit members (see Table 1) and to a lesser extent by increased numbers of unrepresented faculty, also non-tenure track (see Table 4).
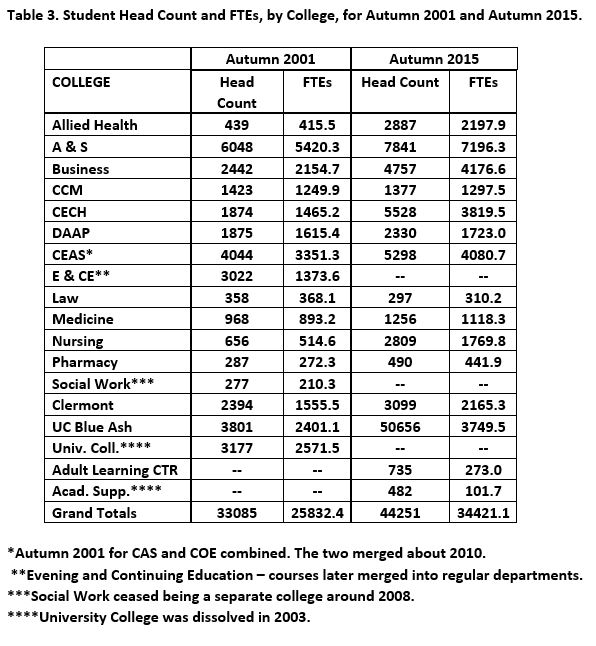
Table 4 shows numbers of AAUP-represented faculty vs. unrepresented (non-AAUP) faculty for Main Campus for 2008 through 2014. “Main Campus” excludes UC-Blue Ash and UC-Clermont. The “unrepresented” figures exclude the College of Medicine clinicians. The unrepresented faculty included in the Table were not members of the AAUP Bargaining Unit, and therefore were non-tenure track. These faculty are in addition to the non-tenure track AAUP-represented members of the AAUP Bargaining Unit as shown in Tables 1 and 2.
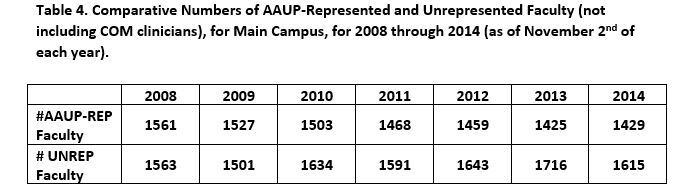
The numbers in Table 4 show once again the steady decline in the relative number of tenured/tenure track Faculty Members. While the numbers of unrepresented faculty fluctuate during the 7-year period charted above, the change in relative numbers of represented vs. unrepresented is clear. From almost equal numbers in 2008, in 2014 there were nearly 200 more unrepresented than AAUP-represented. When coupled with the striking reduction of tenured/tenure track among AAUP-represented faculty, the trend is clear. Proportionately more and more of the total faculty is comprised of non-tenure track individuals.

When data for individual colleges is examined, it is clear that usage of unrepresented faculty is not uniform. While the numbers of unrepresented faculty remained rather steady in some colleges, or even declined, in other colleges there were significant increases in the utilization of unrepresented faculty. Greatest increases were seen in Allied Health Sciences, Business, and Nursing. In Allied Health Sciences, usage of unrepresented faculty increased from 119 in 2008 to 150 in 2014. In Business, the increase was from 39 in 2008 to 118 in 2014. And in Nursing, there were 99 unrepresented faculty in 2008 and 219 in 2014.

Finally, from what we have already presented, it would be presumed that more and more teaching is being done by other than tenured/tenure-track faculty. As noted earlier, we examined data from Institutional Research showing student credit hours taught by various instructor types for the Autumn semesters of 2012 through 2016. Unlike the other data we examined, these data appeared to be inconsistent with regards to who was included in each faculty category, both by year and among colleges. Some numbers fluctuated dramatically during the period and were contradicted by other data that we knew to be accurate. Other numbers made no sense at all. For example, in 2012, at Blue Ash, 32% of all teaching was attributed to “Other Full-Time Faculty”, meaning that it was not done by Tenured/tenure-track, Adjunct, Clinical, Educator, Field Service, Research, Visiting or Practice faculty. What other kind of full-time faculty are there, and how could they have done 32% of the teaching? And Blue Ash was not the only college that had a high percentage of teaching done by “Other Full-Time Faculty.”

Nonetheless, some trends were apparent even in that short time period (2012–2016). During that 5-year period, the reported percentage of student credit hours taught by “Adjuncts” (we are not sure if this included, in all colleges, both represented and unrepresented adjuncts) University-wide rose from 20.8% in 2012 to 23.9% in 2016. Similarly, during the same period, the percentage of student credit hours taught by “Educator” faculty and “Field Service” faculty combined rose from 20.3% in 2012 to 26.1% in 2016. We combined these two categories because there were some title changes during that time period, from Field Service to Educator, that corrected prior misuse of the Field Service title.

DISCUSSION AND CONCLUSIONS

The trend over the last 15 to 20 years is clear. The UC faculty is becoming increasingly non-tenure track as a result of changes in the makeup of the AAUP Bargaining Unit and because of the increasing use of non-Bargaining Unit faculty. As a corollary, students are increasingly being taught by non-tenure track faculty.

By making these statements of fact, the authors are in no way demeaning the teaching contributions of non-tenure track faculty. Many of the latter are excellent teachers and tenure status doesn’t necessarily mean that an individual is an excellent teacher. Appointing full time faculty who are on time-limited contracts rather than granted tenure which is not so time limited allows for “flexibility,” the ability to add to or reduce the supply of instructors to meet demand within an area of teaching. Non-tenure track faculty are not expected to do as much or any research thus allowing them to focus on revenue generating activities like teaching.

But there are other things at issue. We are a Carnegie Research I institution so there must be a steady balance between the numbers of tenured/tenure-track faculty (research active) and the numbers of non-tenure track faculty (educator, non-research active). Our students deserve to be taught by faculty who are doing the most current research and can offer teaching and supervision that is the most up to date. Tenure affords a high level of protection for faculty from pressures from administrators, legislators, other faculty, or the public to censor their opinions or focus of teaching. We see that in the concerns of yet-to-be-tenured faculty who are often concerned about offending anybody and those who do not benefit from tenure who are concerned about being reappointed.

The stability of the faculty, and the security of the faculty, have a direct relation to the power of the faculty in determining University policies and University priorities. And the stability of the faculty and the security of the faculty are directly dependent upon the existence of tenure. The erosion of tenure has direct implications for loss of faculty influence and control over the educational process.


*Daniel Langmeyer is Professor Emeritus of Psychology at UC, the 2016 recipient of the AAUP-UC Chapter’s Maita Faye Levine Outstanding Service Award, and a current Chapter Trustee.

Dave Rubin is Professor Emeritus of Biology at Central State University, former Executive Director of the AAUP-UC Chapter, and a current consultant to the Chapter.
Click here to go back to the top of the page.


Kiss Me, I’m Union


On March 10th the AAUP-UC Chapter hosted a successful membership solidarity event at the Irish Heritage Center of Greater Cincinnati.

Faculty found time to discuss the progress and future plans of the AAUP, but also to celebrate with the sounds of the high-energy, traditional Irish band The Drowsy Lads.
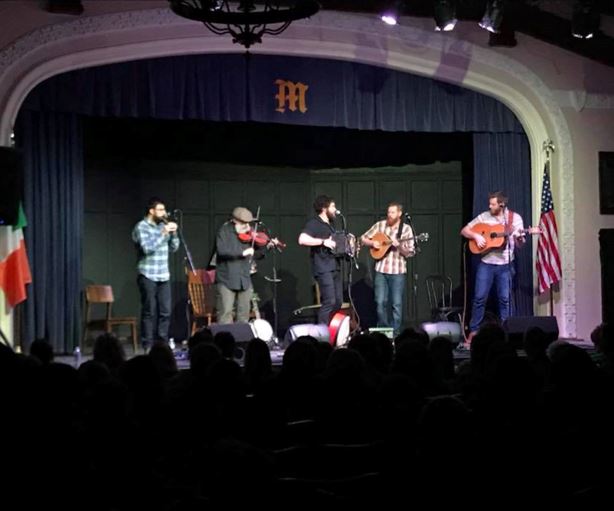
In addition to enhancing our own connections, the Chapter contributed to the broader community by donating a portion of all tickets purchased to the East End Adult Education Center.

Thanks to all the Faculty Members who attended the event. The turnout was great and the event was a tremendous success.


Click here to go back to the top of the page.

AAUP-UC 365

AAUP-UC 365

When faculty think of AAUP-UC, most probably think of the contract. The contract is important. Through it, and collective bargaining, the faculty have achieved some tremendous improvements, including increases in faculty development funds, paid parental leave, as well as defeating efforts to impose enormous health insurance fees.

The contract and the benefits and protections that it brings for faculty will continue to be important, but we are more than a Contract. The AAUP-UC cannot effectively counter the powerful institutional and political forces working to degrade the mission and quality of higher education with a membership that is only active every three years at contract-negotiation time. We need a dynamic AAUP-UC that is in continual engagement with the multitude of problems at UC–problems that impact faculty working conditions, problems that interfere with faculty’s ability to produce substantive research and scholarship, and problems that diminish our ability to effectively teach our students. We need an AAUP-UC that is working 365 days a year, every year.

The Associates Council is working to make this happen. We have begun to organize faculty Action Teams that will be asking you to share the problems you face locally, in your department or college, that prevent you from achieving your best as an educator and researcher.

You may, for instance, be frustrated with the inadequacy of the technology or the design of the classroom space where you teach. Perhaps you are experiencing “service creep” that diminishes your effectiveness as a teacher and researcher. Or maybe you have observed, as so many of us have, that your unit’s over-reliance on term-appointed adjuncts rather than faculty with longer-term contracts not only impacts the physical, emotional, and financial health of these instructors, but also the quality of the programs in which they teach.

The goal is to organize around our shared values as a faculty. These Action Teams will work to develop actionable solutions to the issues that impact us “right where we live” within our institution.

If you have a local issue impacting your work that needs to be addressed, or you are interested in becoming a member of an Action Team, please contact us at campagc@ucmail.uc.edu or cassandra.fetters@uc.edu 

When AAUP-UC was formed in 1976, the faculty did not gather around a table and say we need a collective bargaining agreement. They gathered to solve a problem. The collective bargaining agreement was just part of the solution to that problem.

The problems at UC are different today but just as numerous as they were in the 1970s. The administration will not solve these problems. The students are not well-positioned to solve these problems. The problems will and can only be solved by we the Faculty.

If you want to discuss a specific problem or are ready to take action, please contact us, or an Associate in your college.

Chris Campagna, Chair, AAUP-UC Associates Council
Cassie Fetters, Vice-Chair, AAUP-UC Associates Council

Back to Top


High Hopes, High Stakes  (Part III): UC Doubles Down


Beginning FY 2006, […], the [athletics budget] will be balanced due to the [Big East’s] lucrative revenue sharing. […] In subsequent years, the [athletics] deficit fund balance will be repaid, thus eliminating the deficit by FY 2012. University Current Funds Budget Plan, FY 2004-2005

The multi-year Fiscal Operating Plan projects further deficit reduction in FY 09 and a break-even operation in FY 10. University Current Funds Budget Plan, FY 2007-2008

FY 2011 stands to be another sound fiscal showing as UC Athletics looks to improve upon the planned deficit of previous years and report a $969,000 deficit at year’s end. …The department is on course with a plan for the future that leads to fiscal responsibility, transparency, and strategic spending. University Current Funds Budget Plan, FY 2011-2012

[T]he fiscal outcomes of college athletics continue to be challenging[.] University Current Funds Budget Plan, FY 2015-2016; University Current Funds Budget Plan, FY 2016-2017; University Current Funds Budget Plan, FY 2017-2018

Well over a decade after UC began competing in the Big East in Fall 2005, and after well over a decade’s worth of rosy predictions that UC’s Athletics program not only would break even, but be able to pay back its deficit, the UC Athletics program is carrying over $176 million in athletics facilities-related debt, and the UC Athletics subsidy has ballooned to over $25 million as of FY17.[i]

In Part I of this series, we examined the validity—and lack thereof—of the common justifications for the enormous spending by academic institutions on their athletics programs, particularly Division I–Football Bowl Subdivision (“FBS”) competition.[ii] We saw in Part II how, over the past 15 years, this mythology helped propel and sustain the UC Administration’s massive spending and building spree on its intercollegiate Athletics program.[iii] Now, in Part III, we take a more detailed look at UC Athletics finances, using the data in the annual reports that the Administration submits to the NCAA. This information is far more revealing than what appears in UC’s Annual Fund Accounting Schedules and shows in often stark terms the financial consequences of UC’s venture into Division I-FBS competition.

On the Revenue Side

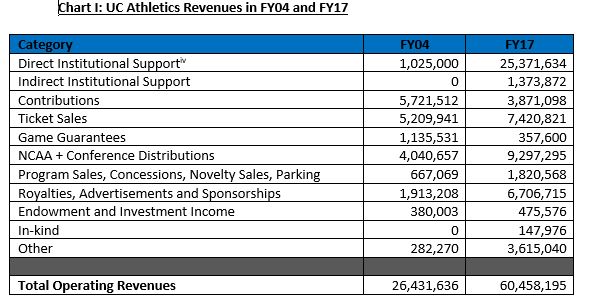
Chart I displays the sources of UC Athletics’ operating revenues from FY04 (one year before it officially began competing in the Big East) through FY17. FY04 dollar figures are inflation-adjusted.[iv] The categories below are defined in the NCAA’s 2017 Agreed-Upon Procedures.[v]


The UC Athletics subsidy now accounts for 42% of the UC Athletics department’s annual revenues, over ten times more than 4% in FY04.[vii] While there have been increases in several other revenue streams, most notably NCAA and conference distributions as well as ticket sales, contributions to UC Athletics have plunged by nearly $2 million since FY04 (after peaking at over $6 million in FY12).[viii]


How UC Athletics’ Dollars Are Spent

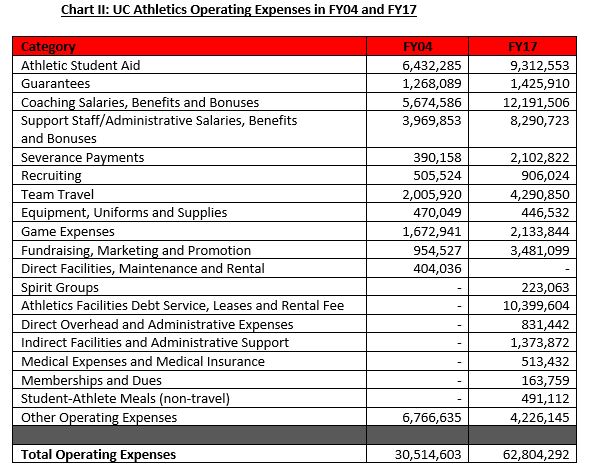
UC Athletics appears to be running a smaller deficit in FY17 (at $2.3 million) as compared with FY04 (at over $4 million) only because the Athletics subsidy has increased so dramatically over that same time. As we observed in Part III of this series, the UC Administration has long abandoned even a public show of hand-wringing over UC Athletics’ finances.[ix]

The most notable hikes in spending relate to UC Athletics personnel: the cost of coaches’ salaries, benefits and bonuses more than doubled from FY04 to FY17, as did the cost of support and administrative staff. Together, coaching and administrative support staff salaries cost over $20 million in FY17. Let’s put this in perspective: the amount that UC spent on coaches’ and Athletics staff compensation in FY17 was only slightly less than the entire FY17 operating expenditures of the College of Design, Architecture, Art, and Planning (“DAAP”) and the College of Allied Health Sciences (“CAHS”) (at roughly $21 million each).[x]

Also, it’s worth noting that, as UC Athletics facilities-related debt skyrocketed to $176 million, the cost of servicing that debt has likewise grown, comprising 16.5% of UC Athletics’ operating expenses in FY17.

A Closer Look at the “Revenue Sports”

As we noted in Part I of this series, one of the common rationales for heavy investments in intercollegiate men’s basketball and football programs is that these are the “revenue sports” which support those programs that usually do not generate enough revenue to be self-supporting (the “non-revenue sports,” e.g., women’s basketball and Olympic men’s and women’s sports.) However, nationwide less than half of men’s basketball and football programs in Division I-FBS were “profitable” in FY15, reflecting a long-term trend.[xi]

From FY09 through FY13, the UC Football program generated revenues over expenses, peaking at a $3 million profit in FY12. From FY14 through FY17, however, the UC Football program has operated deeply in the red, with an average $5 million annual deficit. UC Men’s Basketball has more consistently shown positive revenues, ranging from a low of $89,000 in FY14 to a peak of $1.9 million in FY05. However, in both FY16 and FY17, UC Men’s Basketball ran deficits of approximately $1 million per year. [xii] The notion that either UC Football or UC Men’s Basketball will soon be in a position to consistently support the non-revenue sports is unrealistic, to say the least.

Conclusion: Where Do We Go from Here?

UC Athletics has $176 million in facilities-related debt and flagship programs which are running deficits; it relies heavily on an annual subsidy which tops $25 million, and it is receiving less in contributions than it did in FY04, before UC began competing in the Big East. It is difficult to see how the UC Athletics program can continue to be sustained, and its debt paid off, without continued, significant, and ever-increasing infusions of cash from UC general funds. There are legitimate questions as to the viability of continuing on this path, both for UC’s finances and its academic mission. As reported in “PBB: System of Growing Inequity,” the colleges are held accountable for their deficits and must pay back loans from the Provost office that covered those deficits, regardless of the detrimental impacts of years of manufactured scarcity. UC Athletics is not held accountable for its deficits and continues to receive more and more money from the Administration. It is long past time for the Administration to confront this deteriorating situation with realism, and to acknowledge and correct the disparities in the way that it treats the UC Athletics program and its colleges.


[i] University of Cincinnati FY2017 NCAA Report (2017).

[ii] Spanja, S. (2017, October 2017). High Hopes, High Stakes: Division I Athletics at UC and the Never-ending Quest for the Big Payday, Part I: The Stakes. Works, 24.

[iii] Spanja, S. (2017, November 2017). High Hopes, High Stakes: Division I Athletics at UC and the Never-ending Quest for the Big Payday, Part II: UC Antes Up. Works, 24.

[iv] https://www.bls.gov./cpi

[v] http://www.ncaa.org/sites/default/files/2017FIN_Agreed_Upon_Procedures_20170515.pdf.  Please note that the categories “NCAA Distributions” and “Conference Distributions” are combined in Chart I.

[vi] In FY04, UC student fees accounted for $4 million of UC Athletics revenues. Beginning in FY05, student fees are not represented as a revenue source. University of Cincinnati FY2004 NCAA Report (2004); University of Cincinnati FY2005 NCAA Report (2005.)

[vii]Note that FY05 marked a dramatic shift in UC-generated funds for UC Athletics; there was no longer a “student fees” revenue stream, and “direct institutional support” increased from $1 million in FY04 to $5.6 million in FY05, and continued to rise ever since.

[viii] University of Cincinnati FY2012 NCAA Report (2012).

[ix] Spanja, S., (November 2017), supra.

[x] University of Cincinnati Annual Fund Accounting Schedules, FY 2017 (2017).

[xi] Spanja, S. (October 2017), supra.

[xii] University of Cincinnati FY2004-FY2017 NCAA Reports (2004-2017).

—Stephanie Spanja, J.D.
Director of Research, UC Chapter AAUP

Back to Top

Performance Based Budgeting: A System of Growing Inequity

[The following is a revised and updated version of “Performance Based Budgeting, Seven Years Later: Decision-Making Inside the Black Box,” Works, May 9, 2017.]

Sold as a tool that would bring much-needed transparency to UC’s budgeting process, performance based budgeting (PBB) was implemented beginning with Fiscal Year 2010 (“FY10”). PBB is transparent in the sense that it provides a set of clear formulas for distributing revenue among UC’s colleges and administrative units. But when it comes to the process of determining how much money each college and administrative unit will receive to fund their operations in the coming fiscal year, PBB is opaque. The most crucial value judgments, those which directly impact the operations and financial health of colleges—and by extension the quality of the student experience—are made by a few identifiable individuals who consult with other unidentified persons, without any structured or public dialogue with and input from faculty, students, and even Deans.

While PBB has an internal logic, it allows for wildly inconsistent outcomes across the colleges, with some colleges’ budgets nearly keeping pace with student enrollment increases, while others fall significantly behind.[i] The proportion of revenues that colleges are allowed to retain is determined without full consideration of the colleges’ actual needs and without realistic appraisals of their respective capacities to generate higher revenue through increased enrollments. In addition, the top-down PBB process has facilitated the gradual redistribution of funding away from colleges and increasingly toward administrative sectors.

The PBB Process: A Brief Overview

The annual PBB process begins in early fall, when the President and the Provost, “through consultation with the Budget Committee (BC) and other stakeholders,” determine how much money the University will need to operate and the University’s projected revenue for the coming fiscal year.[ii]  The BC is chaired by the Senior Vice President for Finance and Administration, and includes senior administrators within Finance and the Provost Office, as well as the Associate Dean for Medical Operations and Finance.[iii] It is unclear exactly which other stakeholders are consulted, be they Deans, faculty members, or others, or how extensive their input may be.

In PBB, the colleges are the primary “revenue producers,” i.e., generators of revenue for the University. Other units that are part of the University’s operations, but that do not themselves generate revenue, are “revenue supporters.” This includes administrative units such as the Registrar, Finance, and the President’s Office.[iv]

When the amount of money needed for the University to operate exceeds its anticipated revenue (as it inevitably does), the gap between the two is called a “threshold.”[v] A share of this threshold is assigned to each college in proportion to their instructional FTEs, major FTEs, and full-time faculty and staff. Shortly thereafter, each college must present a plan for meeting its share.[vi] This plan may include increasing enrollment, proposing fee increases, decreasing expenditures (“cost savings and efficiencies”), or a combination of the three. At the end of the fiscal year, if the college takes in more revenue than is necessary to meet its threshold, then it will split an undefined, “agreed upon percentage” of that revenue with the Provost office. If a college fails to meet its threshold share, then its budget will be cut.[vii] (Note that the process by which colleges present their threshold plans is the only official input that the colleges have in the PBB process, and that this process occurs only after their threshold shares have been determined.)

It might be easier to see how this works if we imagine a simple example. Say that University Y is comprised of 2 colleges: A and B. Through PBB, University Y has determined that it needs $110 million to operate. However, it projects that A and B will only bring a combined total of $105 million in revenue, leaving a $5 million short fall. This $5 million is the threshold. By headcounts of FTEs, full-time faculty and staff, College A is deemed to be the larger of the two colleges (and a larger consumer of University Y’s resources, such as administrative support and maintenance). So, College A is assigned $3 million as its threshold share, and College B is assigned $2 million. Colleges A and B now have to submit plans for how they will meet their thresholds, either by cutting budgets or through growth. If they fail to meet their shares, then their budgets will be cut. If they exceed their shares, they will split a portion of the profits with University Y.

PBB’s Impact on the Colleges

We have already seen the disparities between increased student enrollments and lagging college budgets, the latter of which is in large part the product of the PBB process.[viii] We have also observed that PBB has had multiple negative impacts on several colleges, including, among others:

  • Discouraging the hiring of full-time faculty and the replacing of retiring faculty;
  • Increased class sizes;
  • Reduced staff support; and
  • Increased student fees for some programs.[ix]

These outcomes are not accidental by-products of PBB. Rather, they are encouraged, sometimes explicitly, in the PBB process. We can see the financial impacts on the colleges by looking at changes over the years in how much of their revenues they have been able to keep—and how much has been designated for administrative and other sectors.

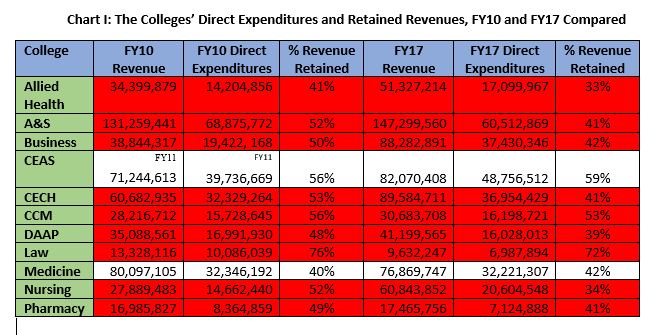
In PBB-speak, “direct expenditures” are portions of revenue from tuition, fees, and State Share of Instruction (SSI) over which colleges retain control. Chart I below shows that, in inflation-adjusted dollars, most colleges retained, or were allowed to keep, smaller proportions of this revenue,  in FY17 as compared to FY10, even adjusting for inflation.[x] To be clear, “direct expenditures” do not include funds derived from other sources, including grants, endowment funding, etc., so the figures below do not correspond with the “Total Expenditures” referenced in the Annual Fund Accounting Schedules that are produced by the University’s Controller’s Office.[xi] Nonetheless, the data below is a revealing barometer of the impact of PBB on college operations.

Note that although UC Blue Ash and UC Clermont submit budget plans through the PBB process, they are separately budgeted and thus are not included in the PBB model. Also, data for the College of Engineering and Applied Sciences is provided as of when it was first available, in FY11, following the merger of the College of Applied Sciences into the College of Engineering.[xii]


As Chart I shows, the vast majority of colleges saw percentage decreases in their direct expenditures (retained total net revenue), despite increases in their total net revenues. Moreover, A&S, DAAP and Pharmacy retained less money in direct expenditures in FY17 than they did in FY10. The case of A&S is especially egregious: despite taking in $16 million more in total net revenues from FY10 to FY17, the amount that A&S was able to keep as direct expenditures actually dropped by $8 million.

The following bullet-points below provide a view of the overall impact on direct expenditures under PBB, and include dollar figures from the Division of Experience-Based Learning and Career Education, as well as the now-defunct College of Applied Science and the Center for Access and Transition:

  • Total net revenues generated by the colleges in FY10: $554 million
  • Direct expenditures (revenue retained by colleges) in FY10: $285 million
  • Percentage of total net revenues retained by the colleges as direct expenditures in FY10: 51%
  • Total net revenues generated by the colleges in FY17: $700 million
  • Direct expenditures (revenue retained by colleges) in FY17: $307 million
  • Percentage of total net revenue retained by colleges as direct expenditures in FY17: 44%
  • Dollar increase in total net revenues generated by the colleges, FY10 to FY17: $146 million
  • Ratio of additional total net revenue to additional direct expenditures: 6.6:1

So, for nearly every $7 in additional revenue that the colleges generated in FY17 over FY10, the colleges were able to keep $1. This begs the question: where did the rest of the money go?

More Money for Administrative Sectors

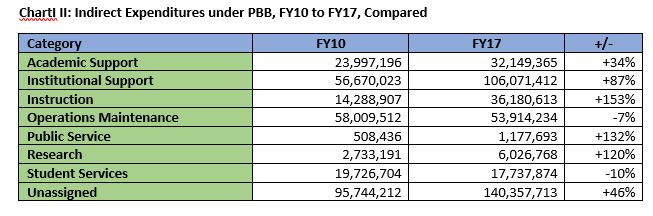
Under PBB, there has been a dramatic redistribution of money away from the colleges and toward administrative and other sectors. Chart II below displays the changes in indirect expenditures from FY10 to FY17. It is important to note that most colleges’ direct expenditures include some spending in several of the categories listed below, but the vast majority are devoted to Instruction, with the next largest category being Academic Support (which includes expenses for Deans’ offices). (It is unclear from the PBB Primer as to what distinguishes an “indirect expenditure” on Instruction from a “direct expenditure.”)

While the largest percentage increase is in Instruction, the largest dollar increase, by far, is in Institutional Support, which grew by nearly $50 million dollars from FY10 to FY16, followed close behind by the category “Unassigned,” with a $44 million dollar increase over the same period. Institutional Support is comprised of a long list of administrative units, including the President’s Office, Legal Affairs and General Counsel, University Health Services, Finance Administration, and Human Resources, among several others. It is not yet clear exactly where the “Unassigned” funds were eventually assigned to and how they were spent.

Conclusion

If one wanted to run a University “like a business,” then PBB would be the budgetary tool of choice. It is profit-driven, concerned with short-term outcomes, indifferent to the particular needs of the sub-units, and provides a conduit for directing more money upward—or at least away from the sectors that generate the revenue, i.e., the colleges. Colleges can’t do their jobs, of course, without administrative support structures. However, whereas 51% of revenues went to the colleges as “direct expenditures” in FY10, by FY17 this proportion dropped to 44%, with the “indirects” taking the rest. This is a significant movement of funding away from the core academic mission.

A robust discussion about the University’s budget priorities should include Deans, Faculty Senate, faculty members at-large, and other stakeholders, and could result in very different outcomes than those under PBB. But for that to happen, the decision-making process about each college’s and administrative unit’s actual needs must be taken out of the “black box” in which it currently exists.


[i] Spanja, S. (2016, December 2016). The More Things Change …: UC Instructional Spending Still Lagging, Despite Increased Enrollment,” Works.

[ii] Primer on PBB and the Revenue and Cost Template, Fiscal Year 2018, Revised 3/30/17, 5, available through the Office for Institutional Research.

[iii] http://www.uc.edu/provost/faculty1/committees/Budget_Committee.html, Accessed Web January 29, 2018.

[iv] Primer, supra, at 4.

[v] Id. at 2.

[vi] Id.

[vii] Id.at 6.

[viii] Spanja, S., supra.

[ix] Spanja, S., (2015, September 2015). PBB: The High Cost of ‘Efficiency, Works.

[x] University of Cincinnati, Revenue and Cost Templates, Fiscal Year 2010, Version 9.0; Fiscal Year 2011, Version 4; 2016, Version 4.1; and Fiscal Year 2017, Version 4.1. The latest known version of each Revenue and Cost Template was used for this article. Dollar figures for FY10 and FY11 were inflation-adjusted using CPI Inflation Calculator, https://data.bls.gov/cgi-bin/cpicalc.pl.

[xi] Spanja, S., The More Things Change, supra.

[xii] Data for the College of Allied Health Sciences in FY10 includes figures for the then-separately budgeted College of Social Work, which was merged completely into Allied Health the following year.

—Stephanie Spanja, J.D.
Director of Research, UC Chapter AAUP

Back to Top

CCM under PBB: A Flagship in Distress

UC Magazine recently celebrated the history and achievements of the College-Conservatory of Music (“CCM”) in “Setting the Stage for CCM’s Sesquicentennial.”[i] At the same time that the Administration is promoting and publicly praising CCM, one of the jewels in UC’s crown, however, it is undermining CCM by using a budgeting system—PBB—which has placed CCM in a near-constant state of financial crisis since FY10.

In “PBB: The High Cost of Efficiency,” Works, September 3, 2015, we examined the impacts of PBB on specific colleges, including CCM. For several years, CCM administrators repeatedly tried to explain to the Provost office that CCM’s physical space, already-over capacity, limited its ability to bring in more revenue through enrollment growth. Moreover, those within CCM pointed out, the highly-specialized, interdependent and one-on-one instruction intrinsic to its mission necessitated maintaining and even increasing its faculty complement, given the strain on current faculty who were carrying well above standard workloads.[ii]  As far as we can tell, there have been no adjustments to the PBB model to accommodate CCM’s unique needs.

According to documents provided by a CCM faculty member who preferred not to be identified, In FY17, CCM had a $1.187 million budget shortfall. This was due in significant part to normal student attrition between Fall 2016 and Spring 2017—normal, but nonetheless devastating to the CCM budget under the PBB regime, which automatically punished CCM with a budget reduction of $979,000. CCM received a bridge loan of $540,821 from the Provost office to cover expenses, and according to the CCM faculty member, made up the remainder of its budget deficit in part by increasing student enrollment through non-major courses and by slashing adjunct pay. To make ends meet, CCM has also had to resort to drawing down from its endowment; from FY15 projected through FY18, CCM’s endowment has dropped by $1.7 million. Clearly, this rate of liquidating endowment assets is unsustainable for the long term. The constant scarcity of funding makes it difficult for even the most basic needs to be met; according to a CCM faculty member, one teaching lab requires the use of floppy disks. Although the college administration knows and sympathizes, there is absolutely no money available to replace it.

In the CCM faculty member’s words:

“It feels like a fiefdom. Because of a drought, the serf’s land does not produce enough to pay the king. The king says ‘You owe me your tariff. Now I have to fine you.’ The serfs say, ‘But we have no money and no food.’ The king says, ‘Okay, I will feed you, but owe me both for the tariff and what I loan you to eat. You owe me no matter what the circumstances, even if there is a drought.’”


[i] Kern, Jac. (2017, September 2017), 18-23.

[ii] Spanja, S., (2015, September 2015), PBB: The High Cost of Efficiency, Works, 22.


Back to Top

Survey Announcement

The Collaborative on Academic Careers in Higher Education (COACHE) survey is scheduled to launch at UC the week of February 5. The survey is organized, overseen, and conducted through the Harvard Graduate School of Education (https://coache.gse.harvard.edu) which will provide aggregate data and summary analysis to UC. The goal of conducting the survey is to provide actionable data for university constituents in order to guide improvements to faculty recruitment, development, and retention. Through COACHE, the data can be compared to results from more than 250 colleges and universities.

Faculty are encouraged to participate in this anonymous Job Satisfaction Survey in order to provide the most comprehensive representation of faculty experiences at the university. The launch team has been headed by Keisha Love, Associate Provost for Faculty Development and Special Initiatives and includes AAUP and Faculty Senate representatives. Results will be available to all faculty and participation by faculty and other UC representatives will be sought to provide ideas and action steps for making improvements based on the data provided. If you have any questions, please contact Cynthia Ris, Chair of the UC Chapter AAUP’s Contract Compliance and Education Committee, at cynthia.ris@uc.edu.

Back to Top