High Hopes, High Stakes: Division 1-FBS Intercollegiate Athletics at UC and the Never-ending Quest for the Big Payday Part II – UC Antes Up


Click here to view “War on Higher Ed”

Click here to view “High Hopes, High Stakes”

President’s Corner

 WAR ON HIGHER ED

As a first generation college student there was, in my family, a belief that higher education was a good thing.  Like many blue collar families, education was the vehicle to a better life.  The biggest problem we faced was that more people needed access to it.

Fast forward to 2017 and this is no longer the case. Higher education is now a wedge issue, a tool to divide people and sow distrust, fear, and resentment.

Look at the U.S. Congress’ proposed budget and its impact on higher education. First, it proposes eliminating the tax exemption on tuition waivers. This means that a student’s tuition reduction in exchange for teaching, research, or other work for the university becomes taxable. In other words, a $40,000 tuition waiver would be counted as income to be taxed. Further, this “income” would push many graduate students into a higher and more heavily taxed income tax bracket. The result for hundreds of thousands of graduate student would be thousands of dollars of extra tax debt per year. This makes it dramatically more difficult to get a PhD or other advanced degree in the United States.

(Note that this bill, as currently written, would not impact UC faculty tuition remission since work is not required for the faculty or their dependents to receive that benefit. Nevertheless, if this bill passes tuition remission benefits such as those guaranteed by the Collective Bargaining Agreement could be the next target.)

The situation gets worse for graduate and undergraduate students upon graduation. Faced with the mounting student-debt crisis does Congress do anything to combat it? Quite the opposite.  They propose eliminating the current tax deduction on student loans (up to $2,500) per year. This will lead to more debt and make higher education less attractive.

The proposed budget also provides an excise tax on some of the largest, wealthiest private school endowments. An initial reaction might be little sympathy for these heavily-endowed private institutions, but the question becomes if they are being targeted today, which other endowments or higher-ed support structures will be next?

Simultaneously with the threats from Washington, or perhaps because of it, faculty are being harassed by individuals and groups that view free speech and academic freedom as threats. This includes the Professor Watchlist that targets faculty that “advance leftist propaganda in the classroom.”

There is a very real war on higher education. These attacks on higher education will intensify and the situation is likely to get worse before it gets better. There is no an easy or universal solution here.  We must continue to look for ways to be a positive influence in our community.  Here are a few suggestions.  Take the time to build relationships with your students and talk to them about these critical issues. Put your name on the Faculty Watchlist in support of your colleagues that are being targeted   If you are not a member, join the AAUP.  Perhaps it is some solace to remember that the AAUP has been fighting challenges to free speech, academic freedom, and other threats to higher education since its inception. The road will be long, the battles many and sometimes brutal, but we will endure and prevail.

 

 High Hopes, High Stakes:  Division 1-FBS Intercollegiate Athletics at UC and hte Never-ending Quest for the Big Payday

Part II:  UC Antes Up

When UC Athletics started competing in the Big East in Fall 2005, it was already over $99,000,000 in debt, and it ran an operating deficit of nearly $7,000,000 for FY06, even with a subsidy of $5.7 million from UC.[i] Ten years later, in FY2016, UC Athletics was over $150,000,000 in debt, and while it technically showed a “surplus” of a little over $1 million, this was only because UC’s subsidy had quadrupled to $23.7 million, fueled in part by several major building projects.[ii] In fact, from FY06 to FY16, the UC Administration subsidized UC Athletics by over $170 million.[iii]

It wasn’t supposed to happen like this. Throughout the past decade and beyond, UC Administration issued a series of optimistic predictions that, in just a few years, UC Athletics would begin to break even—or at least not require more than the subsidy it had received in the early 2000s. With each year, this goal appeared to recede further into the horizon. Now, where once the distressed state of UC Athletics’ finances was a topic of extended discussion and concern at meetings of the Board of Trustees (“BOT”), there is barely mention of this issue anymore, much less identification of it as a problem to be addressed. The price of admission to a major conference—the Big East—and the price of seeking future admission to a Power Five conference, in the form of “investments” in facilities and lavish compensation for coaches—has now become an ongoing cost of doing business, accepted seemingly without question by UC Administration and the BOT.

Why is this so? The willingness to spend more and more on UC Athletics likely stems in part from the continued belief in the prevalent myths about intercollegiate athletics (see Part I). These misconceptions, and the failure to undertake a cost-benefit analysis based on actual data, as opposed to emotion, are at the root of many decisions that UC Administration and the BOT have made which have brought the University to this point. The following is a look at how UC Athletics landed where it is today—heavily subsidized and deeply in debt.


2002: UC Starts Spending Big to Hit the Big Time

At its November 36, 2002 meeting, the BOT approved the construction of Varsity Village, at a cost of $109 million.[iv] The Varsity Village project included, among other things, “the construction of an Athletics Center, outdoor fields and courts, a below grade in-fill garage, the Student Health Services project, the University Multipurpose Club project.”[v] UC Athletics was expected to cover $41 million, or just over a third, of the total cost through donations, but only had $4 million on hand during the construction process.[vi] So, the BOT allowed the University to borrow to cover the unfunded portion of UC Athletics’ obligation, to “bridge the receipt of the remaining gifts.”[vii]

Interestingly, UC was not in a strong financial position when the BOT allowed it to add over $100 million to its debt load to fund the Varsity Village project. Just one year prior, in November 2001, the BOT had called a special meeting to address “some serious financial problems,” namely, an $11 million shortfall due to mid-year budget cuts from the state; the BOT addressed this problem in part with a 2% mid-year tuition increase.[viii] In fact, the Ohio State Share of Instruction (“SSI”) had been dropping for years, with no increases on the horizon, as the BOT publicly acknowledged in a November 5, 2001 special meeting at which it approved an emergency mid-year tuition increase to address an $11 million shortfall in state funding.[ix]

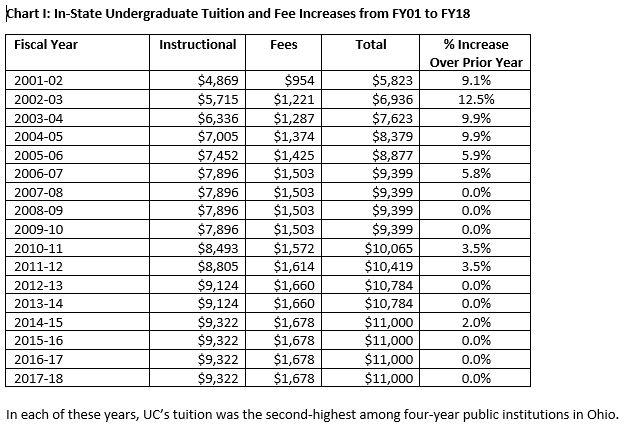
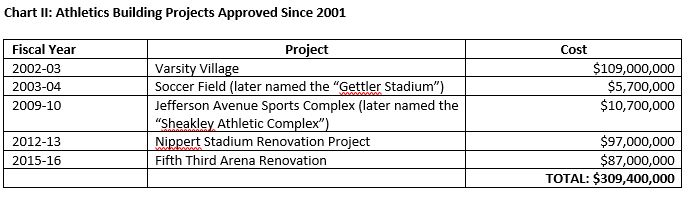
In fact, the BOT raised tuition significantly—by 9.1% for 2001-02, and again by 12.5% for 2002-03—prior to approving the Varsity Village project, which is itself extraordinary. (See Chart I) Even more stunning was the lack of any public deliberation at that meeting as to whether it would be wise for UC to take on such a huge debt burden for Varsity Village, given the plunge in state funding and the recent large tuition hikes. Similarly lacking was a discussion of whether UC Athletics realistically could be expected to raise over $40 million in donations to help fund the project, given that it was projected to receive the same $4.1 million in donations in FY03 as it had in the previous year—and even with those donations, it required approximately $4.5 million in subsidies to balance its budget.[x] Varsity Village was just the first in a series of major UC Athletics building projects undertaken since 2002, at a combined total cost of over $300 million. (See Chart II)
 

2003–2006: UC Enters the Big East

The Varsity Village project was in part an effort to enhance UC’s attractiveness to a major conference suitor. This effort bore fruit in November 2003, when UC announced that it had accepted an invitation to leave Conference USA and join the Big East, a major conference which would afford the UC football team to compete in Division I-FBS (then “Division I-A: “Championship Series”).[xi]

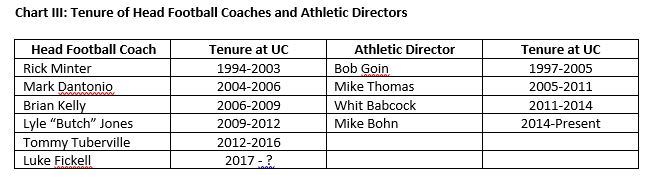
The period from 2003–2006 is notable not only for the firing of men’s basketball coach Bob Huggins in August 2005[xii] and his replacement by Mick Cronin,[xiii] but also for the beginning of an era frequent turnover of football coaches and Athletic Directors at UC. In January 2004, Mark Dantonio became the first of five new head football coaches who would be hired at UC between 2004 and 2016. Two years later, in 2006, Mike Thomas replaced Bob Goin as Athletic Director; he would be succeeded by three Athletic Directors (“ADs”) in less than ten years. (See Chart III)
In his remarks to the BOT at its June 27, 2006 meeting, AD Mike Thomas reflected the prevailing sunny outlook among UC leadership when he expressed high hopes for UC Athletics in the coming years, saying “[W]e are going from good to great. We want to be the DAAP and CCM of college athletics.”[xiv] Thomas commented that the recently-dedicated Richard E. Lindner Varsity Village was a “difference maker” which put UC “ahead of the Big East facilities curve and is already paying dividends, especially in the area of recruiting.”[xv] In a nod to one of the rationales for investment in Division I intercollegiate athletics, Thomas stated: “We cannot underestimate athletics’ role in the marketing of this institution and [we] recognize that athletic success is crucial to our ongoing efforts of extending our boundaries beyond the institutional draw of Southern Ohio.”[xvi]

Optimism does not pay the bills, however. Year by year, state funding continued to comprise a shrinking portion of UC’s overall revenues, dropping from 25% in FY03 to 21% in FY06.[xvii]  During this time, tuition continued to rise, going up by 5.9% in FY06, the first year of UC’s membership in the Big East. (See Chart I) While the UC Athletics subsidy held roughly steady at $5.7 million, FY06 would be the last year that it would remain below $10 million.


2007–2009: Winning, But Not Breaking Even

At the end of 2006, Brian Kelly became the new head football coach.[xviii]  The UC football team made several bowl appearances both immediately before and during Kelly’s tenure, including the International Bowl and the Papa John’s Bowl in 2007 (both of which UC won), the Orange Bowl in 2009, and the Sugar Bowl in 2010.[xix]

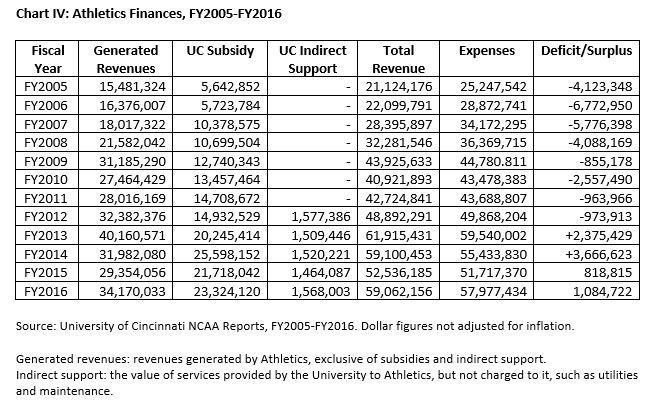
Although the UC football team was experiencing success on the field, UC Athletics’ overall financial situation was not improving. Revenues failed to keep pace with expenses, the UC Athletics subsidy more than doubled from FY06 to FY09, when it topped $12 million, and UC Athletics continued to run millions in deficits. (See Chart IV) Minutes of the BOT from that era reflect an increasing sensitivity—and defensiveness—about this issue. For example, at the June 24, 2008 BOT meeting, then-Senior Vice President of Administration and Finance Monica Rimai noted that “one of the huge challenges Athletics will always have is much of their economic fates are dependent upon their win/loss record.”[xx] Continuing, Rimai asserted that “Athletics is as much a part of the student experience as MainStreet, as the Rec Center, as Enrollment Services, as any of the other services that we deliver to our students. And so we have to embrace and support its effort to address its budget challenges just we have embraced all these other areas.”[xxi]
To address UC Athletics’ financial situation, Rimai (by then, Interim President) convened an All-University Task Force on Athletics in August 2009. Pres. Rimai’s charge included the following:

Similar to research prominence of renowned faculty, sports play a significant role in building goodwill, respect and recognition for our university as well as providing valuable lessons in teamwork and leadership for our student-athletes. […] [It is imperative that we engage in a thorough assessment and lively dialogue about the role of Athletics in our university community, priorities in an environment of declining state support and how best to sustain Athletics into the future. […] One of the key issues that the Task Force will need to help us figure out is where Athletics fits in with our university budget priorities and how to solve this recurring issue.[xxii]

Note that the Task Force was not to consider whether the Athletics subsidy—and by extension UC’s Division I-FBS status—was sustainable, but rather how to sustain it. Far from promoting a “lively dialogue” about Athletics, the charge was constructed to discourage it. This was no doubt by design. At the June 23, 2009 meeting at which Rimai proposed formation of the Task Force, BOT member Tom Humes made clear that it was:

particularly important not to get into a conversation over what’s most important because if there is a conversation about what’s most important, the academics must always win because the academics drive our institution. But the role that Athletics plays in stimulating and helping the academic and all the other things with the university needs to be looked at. So I think it’s important that the task force look at things not as an either or but how do we join things together and make them collectively more productive.[xxiii]

BOT member Stan Chesley similarly opined: “I think we have to factor in this whole issue of what sports does for the overall university community whether it be students, alumni, or the community and what that brings to us and you can never put the dollars and cents in it, but I really, really feel strongly that part of our plus in raising money for [the] endowment is that fact that we do have an attractive Athletics.”[xxiv]

Given these constraints, it is no surprise that the Task Force’s final report was a muddle. Concluding that “Intercollegiate athletics at UC is important and has been beneficial,” the Task Force listed its benefits, including “increases awareness of UC,” “maintains an important connection with UC alumni,” “helps attract new students to look at UC,” “enhances the college experience for current students,” “builds diversity,” and “increases the likelihood of donations, both to athletics and academics.” [xxv]

The Task Force arrived at these conclusions in part on the basis of a two-page summary of a literature review which itself concluded that evidence of the quantifiable benefits—student applications and enrollment—was “mixed.”[xxvi]  Notably, the Task Force downplayed the evidence from its own survey of faculty, students, alumni, and staff “to determine how the university community felt about the athletics program in relation to various other programs at UC.”[xxvii] The Task Force had asked the respondents to

rate the relative importance of ten components of the University’s mission (Faculty, Administration and Leadership, Music and the Arts, Student Life, Intercollegiate Athletics, Community Engagement and Service, Academic Programs and Curriculum, Diversity, Research, and Physical Campus/Buildings and Grounds).[xxviii]

According to the Task Force, each group of survey respondents ranked “Academic Programs” and “Faculty” the highest, and “Intercollegiate Athletics” lowest in importance.[xxix] While they “talked about athletics as being important,” each group of respondents “commented that UC shouldn’t fund athletics at the expense of academics.”[xxx] The Task Force noted only that the survey respondents recommended “balance,” but didn’t elaborate.[xxxi]

With respect to UC Athletics’ finances, the Task Force noted that “revenue follows winning,” but winning clearly was not enough to compensate for several impediments to generating revenue that the Task Force identified, including “a lack of premium revenue amenities and the limited capacity of the football stadium” and a relatively small basketball arena,[xxxii] as well as “a historical lack of interest in UC sports” and “lower benchmark levels of spending to build revenues” (such as on “marketing and fundraising efforts”).[xxxiii] The Task Force also took note of UC Athletics’ “large debt service that was created largely cause of unmet fundraising goals for the Varsity Village project,” and further asserted that “the university did not fully institute a funding model for entering the Big East Conference.”[xxxiv]

Rimai’s charge included the question, “What is the appropriate size of our athletics budget?”, but the range of acceptable answers was clearly limited, given the parameters of the charge itself.[xxxv] So, unsurprisingly, the Task Force did not directly answer this question, stating only that “it could take as much as $11 million additional annually to be competitive in the Big East Conference”, and recommending a “a three-stage plan to appropriately fund athletics”:

  • remove the annual deficit,
  • pay back the overall deficit, and
  • generate the additional revenue and funding to reach the desired level of funding to be competitive in the Big East.[xxxvi]

To help achieve these goals, the Task Force recommended, among other things, increases in student fees, the restoration of approximately $700,000 of the UC Athletics subsidy which had been designed to ensure that UC met NCAA certification standards for Olympic sports scholarships, but which had not been paid in three fiscal years, and the partial or completely assumption of UC Athletics’ deficits.[xxxvii] These recommendations aligned perfectly with the sentiments expressed by Rimai and the BOT members at their meetings.

The Task Force concluded that UC should “maintain a ‘balance’ of priorities for funding athletics, but not at the expense of other important functions.”[xxxviii] The Task Force never actually stated what “balance” actually would look like, particularly if UC found itself (again) in financial straits. Thus, the Task Force never grappled with the hard questions (which might yield unpopular answers), such as whether the UC Administration should prioritize hiring more faculty or paying coaches more money, or which “inadequate facilities” should be renovated first—academic buildings or football stadiums?  In a budget squeeze, which is the higher priority?  And what if UC can’t do both? Should it drop back to Division II? These questions were left unanswered because Rimai’s charge, reflecting the BOT’s own priorities, kept them off the table.

The UC Faculty Senate responded to the Task Force’s report in a March 11, 2010 resolution recommending that UC Administration “not allocate more general funds money to subsidize the athletic department,” “not assume any portion of the Athletic Department’s accumulated deficit,” and “pursue negotiations for the use of Paul Brown Stadium for all or some portion of the university’s home football games instead of expanding Nippert Stadium.[xxxix] UC Administration did not act upon this resolution. Similarly, UC Administration and the BOT brushed aside faculty concerns expressed four months earlier,  when the Faculty representative to the BOT, Marla Hall, had objected to the proposed $10.7 million Jefferson Avenue Sports Complex because faculty had not been consulted and because “it departed from the original plan of waiting to start construction until donations were in hand.”[xl] Unsurprisingly, the Board approved it, with BOT member Jeff Wyler commenting, “The only way we can continue to compete in the Big East and be successful is to get our facilities up to par.”[xli]


2012 and Beyond: Scrambling for a Seat at the High-Rollers’ Table

In February 2013, the Board of Trustees approved the initial stages of the Nippert Stadium expansion, a project that UC Administration was “actively pitching” as it tried to join the Atlantic Coast Conference (“ACC”).[xlii] UC’s desire to join the ACC was fueled in part by the realignment of the Big East conference, which ultimately resulted in the departure of several of the FBS schools to other conferences (such as Rutgers’ entry into the Big Ten, as discussed in Part I), while the remaining football-playing schools formed the American Athletic Conference (“AAC”).[xliii]

At its June 2013 meeting, the BOT gave final approval to the Nippert Stadium renovation project, at a cost of $97,000,000.[xliv]  However, UC Administration maintained that “no university general funds are paying for the project. Instead, private donations and premium seating options will fund the project over a period of years.”[xlv] Notwithstanding, over this same time period, the UC Athletics subsidy skyrocketed, topping $20 million in FY13 and reaching an all-time high (for now) of over $25 million in FY14. Incredibly, though, at the June 2013 and June 2014 BOT meetings, Senior Vice President for Administration and Finance Bob Ambach declared that FY13 and FY14 were “break even” years for UC Athletics.[xlvi] Evidently, the era of worrying about UC Athletics’ financial health and self-sufficiency, or at least making a public show of it, was over. Since FY13, the UC Athletics subsidy has never dropped below $20 million.

Following UC’s unsuccessful bid for a place in the ACC, UC made strenuous efforts to gain admission to the Big 12. Around this time, in Fall 2015, the BOT approved design services for the renovation of Fifth Third Arena, and subsequently the project itself, at a total cost of $87 million, $40 million of which would “be raised privately through donations and revenue based bonds with zero state funding”, according to Athletic Director Mike Bohn.[xlvii] Although mention was made of classroom spaces that the renovated Arena would include, clearly the main focus was again on enhancing UC’s attractiveness to a Power Five conference. Responding to concerns from the Faculty Senate representative, Tracy Hermann, about the expense of the project, Board President Rob Richardson stated:

We understand with any investment, there’s always some risk. … [W]e always consider the big picture so we never lose sight of the fact that we are an academic institution but we also made a decision that we are going to be competitive and we are going to make imprint in sports and we think that is also important. … If we don’t make an investment, we do know there will be little chance that we will be able to get into a major conference and doing that will take a lot of burden off of the general fund.[xlviii]

Moving forward on the Fifth Third Arena project ultimately did not win UC a spot in the Big 12. On October 17, 2016, the Big 12 announced that it would not be expanding, leaving UC and other hopefuls out in the cold.[xlix]  For the time being, then, UC remains part of the AAC, which currently is trying to raise its stature by rebranding itself as part of the “Power Six” (as opposed to the much less wealthy and prestigious “Group of Five,” which also includes the Mid-American, Mountain West, Sun Belt and Conference USA).” [l]

Later in 2016, the revolving door of football coaches turned once again, when UC’s football team saw the resignation of coach Tommy Tuberville, who had been at UC since 2012 (when he replaced Butch Jones, who in turn had replaced Brian Kelly in 2009). The circumstances of Tuberville’s departure were particularly odd; only two months before he resigned, Tuberville and UC Administration not only had agreed to a two-year contract extension, but also had agreed that Tuberville would receive $2.4 million, or more than double what he would have received, if he were fired after the 2017 season.[li]  It is unclear from the public record why UC Administration would agree to a contract extension on such favorable terms, especially since the UC football team had had a 3-3 record at the time the extension was agreed upon.


Conclusion

The story of UC’s entry into Division I-FBS and its significant outlays of money for athletics building projects and subsidies is marked by the failure to fully investigate the assumptions underlying the presumed intangible and tangible benefits of big time intercollegiate athletics—in other words, the failure to separate emotion from fact. Lost in these discussions are fundamental questions: isn’t there a more cost-effective way for UC to market itself, without paying coaches millions, subjecting itself to the whims of Power Five conferences which may never open their doors, and staking its prospects on the hope of winning seasons? Isn’t it possible to build community and school spirit in other ways? UC’s colleges are held to stringent expectations that they meet revenue targets, through the “Performance-Based Budgeting” process, even having to pay back “loans” to the Provost office when they run deficits. UC Athletics appears to be insulated from such expectations, as talk of paying back its deficit has long since quieted. That this inequity remains unquestioned, at least publicly, among UC Administration is alarming, and carries potentially even more expensive consequences as UC tries to spend its way to athletic glory.


[i] University of Cincinnati Financial Report to the NCAA, 2006.

[ii] University of Cincinnati Financial Report to the NCAA, 2016.

[iii]University of Cincinnati Financial Reports to the NCAA, 2006-2016.

[iv] Minutes of the Meeting of the University of Cincinnati Board of Trustees, November 26, 2002.

[v] Id.

[vi] Id.

[vii] Id.

[viii] Minutes of the Special Meeting of the University of Cincinnati Board of Trustees, November 5, 2001.

[ix] Minutes of the University of Cincinnati Board of Trustees, November 5, 2001.

[x] University of Cincinnati Current Funds Budget Plan, FY 2002-2003, p. 53.

[xi] Dow, Dustin. “Big East a Big Leap for UC.” Nov. 4, 2003. www.cincinnati.com.

[xii] Schlabach, Mark. “Cincinnati Orders Huggins to Resign Today or Be Fired.” August 24, 2005. www.cincinnati.com.

[xiii] Koch, Bill. “Cronin Takes Over Bearcats.” March 24, 2006. www.cincinnati.com.

[xiv]Minutes of the Meeting of the University of Cincinnati Board of Trustees, June 27, 2006.

[xv] Id.

[xvi] Id.

[xvii] University of Cincinnati Current Funds Budget Plan 2002-2003 at 4, 2005-2006 at 4.

[xviii] Koch, Bill. “UC Hires Central Mich. Coach.” December 4, 2006. www.cincinnati.com.

[xix] Cincinnati Bearcats School History. Retrieved from: https://www.sports-reference.com/cfb/schools/cincinnati/

[xx] Minutes of the Meeting of the Board of Trustees, June 24, 2008.

[xxi][xxi] Id.

[xxii] All-University Athletics Task Force Report, January 4, 2010, at 2.

[xxiii] Minutes of the Meeting of the Board of Trustees, June 23, 2009.

[xxiv] Id.

[xxv] Id. at 7.

[xxvi] Id. at Appendix 8.

[xxvii] Id. at 6.

[xxviii] Id.

[xxix] Id.

[xxx] Id.

[xxxi] Id.

[xxxii] Id.

[xxxiii] Id.

[xxxiv] Id. at 4.

[xxxv] Id.

[xxxvi] Id. at 8.

[xxxvii] Id. at 9-10.

[xxxviii] Id. at 7.

[xxxix] Proposed Faculty Senate Resolution Regarding the Recommendations of the Athletics Task Force, approved March 11, 2010. Retrieved from: http://www.uc.edu/facultysenate/governance.html.

[xl] Peale, Cliff. “UC Athletic Complex Gets OK.” November 18, 2009. The Cincinnati Enquirer. www.cincinnati.com.

[xli] Id.

[xlii] Peale, Cliff. “UC Hopes Overhaul of Nippert Woos ACC.” February 19, 2013. The Cincinnati Enquirer. www.cincinnati.com.

[xliii] “New Name in College Sports: Current BIG EAST Enters New Era as ‘American Athletic Conference.” April 3, 2013. Retrieved from: https://web.archive.org/web/20130406033911/http://www.bigeast.org/News/tabid/435/Article/243706/new-name-in-college-sports-current-big-east-enters-new-era-as-american-athletic.aspx.

[xliv] Minutes of the Meeting of the Board of Trustees, June 25, 2013.

[xlv] Bach, John. “Nippert Stadium Update.” October 2013. UC Magazine.

[xlvi] Minutes of the University of Cincinnati Board of Trustees, June 25, 2013 and June 23, 2014.

[xlvii] Minutes of the University of Cincinnati Board of Trustees, August 25, 2015 and December 15, 2015.

[xlviii] Minutes of the University of Cincinnati Board of Trustees, August 25, 2015.

[xlix] Williams, Jason. “UC Officials: ‘Stand with Us as We Fight On.” October 17, 2016. The Cincinnati Enquirer. www.cincinnati.com.

[l] Groeshen, Tom. “UC Is Part of ‘Power 6’ AAC Plan.” July 18, 2017. The Cincinnati Enquirer. www.cincinnati.com

[li] “Buyouts Higher for UC in New Deal for Tuberville.” October 14, 2016. The Cincinnati Enquirer. www.cincinnati.com.

—Stephanie Spanja, J.D.
Director of Research, UC Chapter AAUP

UC’s FY18 Budget Plan: A Look at the Year Ahead

4Click to read to read Leadership Corner
CLick to read to read UC’s FY18 Budget Plan
CLick to read to read Distance Learning Programs: Who Profits?
CLick to read to read 2017 Salary Increases

ARE YOU AN AAUP-UC MEMBER?

Best wishes at the outset of Fall Semester. We hope that this Academic Year is productive and rewarding.

At the advent of a new semester, we want to highlight the many services the AAUP-UC Chapter provides to faculty. The AAUP-UC is probably most recognized every three years, when a team of faculty assisted by Chapter staff negotiates the Collective Bargaining Agreement (CBA). The CBA is critically important. Without it, the administration could make unilateral changes to faculty working conditions, including wages and benefits. Unfortunately, UC has done just that to its unrepresented employees.

However, the CBA is just part of what the AAUP-UC does every year. AAUP-UC elected faculty leaders and Chapter staff work with faculty members on all aspects of implementing and enforcing the CBA, and assist faculty when grievances arise. Grievances can occur over discipline, reappointment, promotion and tenure, research integrity issues, or any matter covered by the CBA. AAUP-UC staff assists and accompanies faculty to mediations, arbitrations, and grievance panel hearings. In the last Academic Year, AAUP-UC staff handled over 140 grievances and responded to nearly 300 additional calls from faculty with questions regarding the CBA and related issues.

AAUP-UC committees, composed of faculty and supported by staff, are active throughout the year as well. The Contract Compliance and Education Committee (CCE) provides education about the CBA to Chapter members, Bargaining Unit members, and members of the administration, including conducting numerous workshops for RPT candidates, RPT reviewers, Unit Heads, and new faculty.

The Budget and Compensation Committee (BCC) conducts a thorough analysis of UC’s budget and highlights problems with spending priorities in articles in Works, the AAUP-UC newsletter. These articles are read widely by the faculty and the administration. This committee also is charged with assisting the AAUP-UC Chapter’s Executive Council and Negotiating Team with budget analysis and the costing of proposals during contract negotiations.

The Political Action Committee (PAC) monitors current political, social, and academic freedom issues that may impact faculty members (e.g. civil rights and equal rights of women, family or LGBT issues; national and state legislation that affects higher education or union bargaining rights; threats to academic freedom on or off campus; State of Ohio budgeting for higher education institutions; Ohio Board of Regents activities and policies). PAC partners with student groups and other campus unions, and has spearheaded several initiatives to raise awareness of issues that impact students and faculty. The PAC also organizes lobbying days in Columbus and, working with the Ohio and National AAUP, in Washington D.C.

The AAUP-UC Chapter also works closely with the Ohio Conference AAUP (OCAAUP) and AAUP chapters across the state to beat back anti-faculty bills in the Ohio legislature that would have reduced sick leave; mandated annual disclosure filing requirements for faculty who assign textbooks to their classes; and required all Ohio universities to review their tenure policies.

Our chapter, then, looks to serve faculty not only by improving the conditions within which we work, but, also, by actively advancing the values that inform and inspire this work in the first place. We as faculty enter this profession because we believe in creating an educated society, and the AAUP-UC Chapter is here to help us achieve this goal.

If you are not a member, support these and other initiatives by joining the AAUP-UC Chapter today.

If you are not sure if you are an AAUP member, contact the AAAP-UC office by emailing aaupuc1@ucmail.uc.edu or calling (513) 556-6861.

Some faculty confuse the “fair share” fee with AAUP-UC Chapter membership. All members of the bargaining unit pay a “fair share” fee, to help bear the cost of representation—as all faculty receive the benefits and protections of the CBA. This is not the same as being a member of the AAUP-UC Chapter.

The difference between the fair share fee and actual membership is minimal. (Click here for a chart demonstrating the difference and other information about membership.) But the impact of membership is tremendous. A large membership makes the Chapter a stronger and a better advocate for the faculty.

Only full AAUP-UC members can attend membership meetings, vote on the CBA, participate in AAUP-UC Chapter committees, and attend Ohio and National AAUP conferences and events.

If you are interested in joining an AAUP-UC committee or have questions about membership, contact the AAUP-UC office today.


Chris Campagna                                                          Cassie Fetters

Chair, Associates Council                                            Vice Chair, Associates Council


Chris Campagna (A&S) and Cassie Fetters (UC-Clermont College) are Chair and Vice Chair of the Associates Council. The Associates Council is a representative assembly and functions as a liaison between the faculty and the Executive Council. Representatives are elected at the college/library level.


UC’s FY18 Budget Plan:  A Look at the Year Ahead

Every year in June, the UC Board of Trustees approves the University’s Current Funds Budget Plan for the following fiscal year. The Budget Plan is both a document in which the Administration explains how it intends to spend the University’s money in the coming fiscal year, and an exercise in public relations—highlighting the University’s achievements in the preceding year and articulating its aspirations for the near future.

Since the Budget Plan is only a “plan” and not a contract, the Administration is not obligated to follow it to the letter, and it frequently makes upward or downward adjustments in spending as it deems necessary throughout the year. Even so, the Budget Plan can yield valuable information and insights into the Administration’s budget priorities for the following fiscal year. We can get a sense of these priorities by comparing the Administration’s projected spending from year-to-year (FY2017 to FY2018) and by taking a longer view, with a ten-year snapshot (FY2009 to FY2018). Moreover, when we consider where the money is coming from—and how that has changed over the past ten years—as well as the increase in student full-time equivalents (FTEs) over the same time period, the trend away from investment in the University’s academic mission that we will see below is even more troubling.


Where the Money Is Coming From: A Sea Change in a Decade

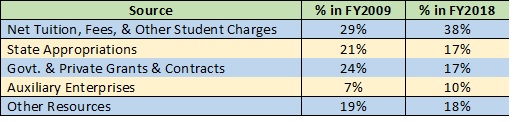
Each Budget Plan includes a pie chart showing the sources of the University’s revenue and their respective percentages of the whole. “Auxiliary Enterprises” refers primarily to Campus Services, which oversees “Parking, Housing & Food Services, Retail Services, MainStreet & Campus Recreation Operations, Kingsgate Conference Center, and Conference & Event Services”; Intercollegiate Athletics is also included in this category.[i] “Other Resources” is not defined, but likely includes private gifts and endowment income, among other sources.

Chart I – Sources of Revenue, FY2009 and FY2018 Compared

Chart I shows that the percentage of revenue from tuition and fees has increased by nearly 10%, now comprising 38% of the University’s revenues, while revenue from Ohio state appropriations has declined to 17% of the total. This reflects the long-term national decline in state support for public higher education, which fell by 16% per student from the 2007-2008 academic year to the 2016-2017 academic year, a decline which was mirrored in Ohio, where per-student funding fell by 15.2% over the same time period.[ii]

The growth in revenue from tuition and fees reflects not only increases in the amounts charged for each (and, with respect to fees, in the multiplying numbers of program-specific fees), but also the increase in FTEs over a similar span. At the start of academic year 2008-2009, UC had 29,594 FTEs; by 2016-2017 (the most recent year available), FTEs had grown by 16.4%, to 34,476. As Charts II and III below demonstrate, budgeting for the University’s core academic mission has failed to keep pace with the growth in student enrollment.


Where the Money Is Going: Two Different Snapshots That Tell the Same Story

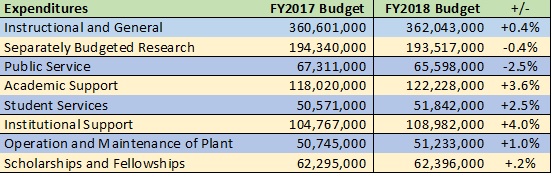
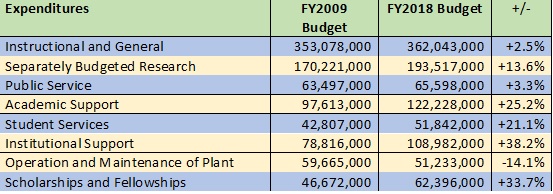
Below are two perspectives on the FY2018 budget: a year-to-year comparison with the FY2017 budget, and a ten-year comparison with the FY2009 budget. Both tell the same and, by now, very familiar story: budgets for Academic Support (which includes Academic Administration and Deans’ offices) and Institutional Support (which includes other administrative offices, such as Finance, the President’s Office, and Human Resources) have increased by much higher rates than the budget for Instructional and General, which supports UC’s faculty, who carry out UC’s academic mission.[iii]

Chart II – Comparing Budgeted Expenditures from FY2017-FY2018


Chart III – Comparing Budgeted Expenditures from FY2009 to FY2018

FY2009 adjusted for inflation using the CPI Inflation Calculator: https://data.bis.gov/cgi-bin/cpicalc.pl

Given the tremendous growth in UC’s FTEs over the past decade, it is only appropriate that there should have been significant increases in the budgets for Student Services and Scholarships and Fellowships over the same period.

However, the fact that the budget for Instruction increased by only 2.5%, while the budgets for the administrative sectors—Academic Support and Institutional Support—increased by over 25% and 38%, respectively, is very concerning. From FY2009 to FY2017, the number of full-time represented faculty remained essentially flat (dropping slightly from 1,728 to 1,726). Had the numbers of full-time bargaining unit faculty kept pace with the growth in FTEs, there would be 283 more full-time bargaining unit faculty now than there are today. The failure to invest in hiring full-time bargaining faculty has had significant impacts on the University’s academic mission, with a heavier reliance on adjunct faculty, increasing class sizes and heavier student advising loads for full-time faculty.[iv]  In addition, the pressures imposed upon colleges by the Performance Based Budgeting process, with the increasingly higher “tax” to support the non-revenue generating (e.g., administrative) sectors, impedes the ability of colleges and academic units to maintain and build their full-time faculty.[v]


Conclusion

Glossy budget plans designed for public consumption cannot paper over the on-the-ground realities faculty and students face as a result of the failure to reinvest in the University’s core academic mission. The numbers speak for themselves: there are more students, who are paying higher tuition and more fees than they were 10 years ago. But the number of full-time bargaining unit faculty who actually carry out the academic mission of this University has remained flat. All this begs the question: are students really getting what they are paying for?

[i] University Current Funds Budget Plan 2017-2018 at 15. www.uc.edu/af/budgetfinsvcs/budgetmgt.html.

[ii] “A Lost Decade in Higher Education Funding: State Cuts Have Driven Up Tuition and Reduced Quality,” Center on Budget and Policy Priorities, Aug. 23, 2017, pp. 4, 5.

[iii] University Current Funds Budget Plan 2017-2018, 2016-2017, and 2008-2009, www.uc.edu/af/budgetfinsvcs/budgetmgt.html. Note that while the “Academic Support” category also includes the Libraries, one of our previous investigations of University spending showed that spending on Libraries had actually declined from FY2009 to FY2014. “Where Is the Money Going? An In-depth Look at University Expenditures (Part I of II),” Works, Vol. 22.6, 23Nov2015. Given that trend, it is highly unlikely that the increases in spending on Academic Support reflected in Charts II and III are attributable to the Libraries.

[iv]These impacts were documented in “Education on the Cheap: Devaluing Students and Faculty, Parts I and II,” Works, 22.3, 30 March 2015, and 22.4, 27 May 2015.

[v] See “PBB: The High Cost of Efficiency,” Works, 22.5, 3 Sept. 2015, and “Performance Based Budgeting, Seven Years Later: Decision-Making Inside the Black Box,” Works, 24.3, 9 May 2017

—Stephanie Spanja, J.D.
Director of Research, UC Chapter AAUP


Distance Learning Programs:  Who Profits?

Distance learning courses and programs provide flexibility to students working towards completion of degrees.  These courses and programs are useful for a range of students, from those who are working full-time to those who live at a distance. Because they do not require physical classroom space, distance learning courses and programs lessen certain overhead costs to institutions of higher education.   There has been tremendous growth in online offerings at the University of Cincinnati (UC) since 2010.  UC currently has “more than 30 online degree programs and 40 online certificate programs, in addition to many fully online general education and professional development courses.”1 UC is moving to an in-house enterprise system called Cincinnati Online as a marketing, recruitment, and retention/advising service for distance learning programs.  It is the intent of the article to explore why and what kind of impact these enterprises have had and may have on the university. The key questions include at what instructional expense are these used and who is making decisions about these enterprises.

Not only has UC profited from the growth of distance learning degree and certificate programs, but corporations who provide services to UC related to these programs also appear to have reaped significant profits.  Numerous degree programs housed in a few UC colleges have contracted with companies such Embanet-Compass Knowledge (owned by Pearson) and Academic Partnership for marketing and recruitment services for distance learning programs.  We submitted a public records request to determine how much these services cost and what percentage of tuition revenue is taken by the service provider.  Although much information was redacted from the contracts UC provided to us, we were able to determine that the operating expenditures designated as “Distance Learning Support”(in the detail for UC’s Annual Fund Accounting Schedules) are payments to these providers.  We were also able to determine from our public records request that for programs contracting with Embanet-Compass Knowledge, these payments represent 40% to 50% of tuition paid by those students recruited by the service provider.  The percentage depends on the number of students recruited.

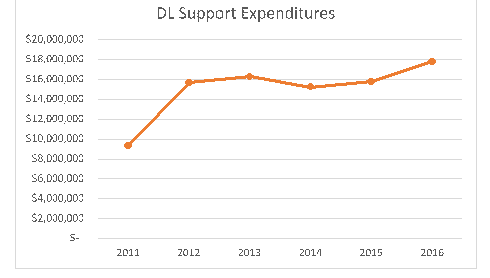
“Distance Learning Support” first appeared as an expenditure in the Annual Fund Accounting Schedules in 2011, although UC programs contracted with Pearson (originally Compass Knowledge, then Embanet-Compass Knowledge) much earlier.  From the graph below of administrative unit Distance Learning Support expenditures, one can see payments to these providers has increased from about $9 million in the academic year ending 2011 to almost $18 million in 2016 (not adjusted for inflation).

The significant amount of these expenditures begs the question: how can these programs be profitable or even break even when they are receiving only half of the tuition for the students in these programs?  It is difficult to pinpoint how decisions about how courses and programs are made to respond to costs—for example decisions about class sizes and number of faculty needed—because these decisions are made on a programmatic basis and would not be reflected on a publically available accounting schedule.

Perhaps the limitations of engaging external service providers has reached its limits. An in-house marketing, recruitment, and retention/advising service has been developed:  Cincinnati Online (http://online.uc.edu/).  This non-profit entity was initiated by the College of Education, Criminal Justice, Human Services, and Information Technology (CECH) and the College of Nursing (CoN).  It was piloted in University of Cincinnati Research Institute (UCRI).  It is to be housed within the Office of the Provost and will be headed by a Vice Provost.  The first search for this new administrative position was unsuccessful.  CECH Dean Larry Johnson and Senior Vice Provost of Academic Affairs Eileen Strempel are co-chairs of Cincinnati Online initiative, which as of this writing, has yet to be fully launched.  Governance and oversight has not yet been finalized.

The Cincinnati Online initiative stands to generate substantial revenues for the university.  Because of its potential impact not only financially but on decisions related to teaching and learning, it is important to ensure that questions are addressed before this initiative is fully launched.  These questions should include how revenues will be invested and how instructional expenditures will be affected as well as who will be at the table when these decisions are made. On May 14, 2015 the UC Faculty Senate put forth a resolution involving distance education.  Will it be considered as Cincinnati Online’s structure is developed?  Input from an inclusive group of stakeholders, including faculty, will ensure that the university benefits not only financially but also in terms of strengthening its core academic mission and in terms of reflecting various disciplinary needs of colleges throughout the university.

1 http://www.uc.edu/distance/courses_programs.html


Sarai Hedges, Chair, Budget & Compensation Advisory Committee, UC Chapter AAUP


AAUP Faculty Annual Salary Increases Effective September 1st

Current faculty who were part of the AAUP Bargaining Unit on or before June 30, 2017 will see annual Across the Board Increases reflected in their upcoming September 29th payroll statement. Per Article 10.1.2 of the Collective Bargaining Agreement, the across-the-board component of the annual salary increase will equal 2% of base salary.

In addition, per Article 10.2, faculty will receive a Compression Adjustment—the aim of which is to address the problem that occurs when salaries of current faculty fail to keep pace with those of recent faculty hires. The compression adjustment is higher the more years of service a faculty member has at UC, up to a maximum of 12 years. To calculate what your compression adjustment will be, follow this link and input the requested information: http://homepages.uc.edu/~pelikas/Compression.html

The 2016–2019 Collective Bargaining Agreement also includes, for the first time, Benchmark Increases. “Benchmark” refers to the Provost Office’s list of UC’s peer or aspirational “benchmark” institutions. The Bargaining Team devised the benchmark increase to help bring UC faculty more in line with these institutions. The increases are flat dollar amounts that are the same for all faculty members, based on a percentage (.25% for 2017) of the average salary for UC faculty. For 2017, the Benchmark Increase is $231.

Finally, regional campus faculty, whose salaries continue to lag well behind those of their counterparts across the state, will receive an additional increase of 1.5%.

Following the Money: The Big Picture, Part II

  • Click here to read the President’s Corner
  • Click here to read Following the Money, Part II
  • Click here to read Performance Based Budgeting, Seven Years Later: Decision-Making Inside the Black Box
  • Click here to read Evolving Intellectual Property Law Raises Questions about Copyright of Faculty Work, Online Courses

President’s Corner

It has been a difficult year for higher education. The president has appointed a secretary of education whose experience and focus is dismantling public education. The president’s proposed travel ban has created fear and uncertainly at universities throughout the country. Neil Gorsuch has been appointed to the Supreme Court, which will once again take up the “fair share” fees issue (Friedrichs round 2) as the National Right to Work Legal Defense Fund looks to file a petition with the Court this month.

Just last week, the Ohio House passed a heavily amended budget bill (HB 64) that has specific provisions targeting faculty, including: requiring post-tenure review at least once every five years; prohibit colleges and universities from providing sick leave greater than what is in the statute, either on their own accord or via a collective bargaining agreement (which would reduce UC faculty sick leave by one-third); require every faculty member that assigns textbooks to fill out an annual financial disclosure form and pay a filing fee.

With all of these controversial issues surrounding higher education, we have only two options to choose from.  Accept defeat or fight.  I, for one, choose to fight.

It is heartening to see other faculty fighting too. On April 22nd dozens of faculty, many wearing AAUP T-shirts, participated in the March for Science in Cincinnati. There were companion events in Washington D.C. and across the country. (AAUP-UC was an event sponsor.)

On May 5th, a delegation of AAUP-UC members was in Columbus. They distributed copies of the Ohio Conference biennial higher education report to state legislatures and explained the purpose and necessity of tenure at Ohio’s universities.

Join the fight. The House budget bill now goes to the Senate with all the ant-faculty provisions described above. Contact your Senator using this link. It is quick and easy.

In June when the AAUP-UC delegates are in Washington, D.C. for the AAUP annual meeting they, along with our colleagues from across the country, will be on Capitol Hill discussing higher education issues with elected officials and their staffs.

And, as has been previously announced, in July the AAUP will be hosting its Summer Institute here at the University of Cincinnati. It’s an honor that the AAUP chose UC and I believe it is a reflection on the UC Chapter’s standing and reputation in the AAUP. The Summer Institute is a unique opportunity to meet higher education advocates from across the country. If you have never attended this is obviously a great and convenient opportunity.

These are difficult times, but we are demonstrating that collectively we can make a difference. The AAUP is an effective organization and we are one of the stronger chapters, but we can and must be stronger. If you are not yet a member, join the AAUP-UC Chapter today. If you are a member, talk to a colleague about joining. The difference between the fair share fee and membership dues is minimal, but the impact of membership is tremendous.

Return to top of page.


Following the Money: The Big Picture: Part II

In the last issue of Works, we examined spending in UC’s colleges and UC Libraries from Fiscal Year 2008-2009 (“FY09”) to Fiscal Year 2015-2016 (“FY16”), a period during which student FTEs increased dramatically, but the majority of college budgets not only failed to keep up with that growth, and some fell significantly behind.[i]  Using the same resources—the University’s Annual Fund Accounting Schedules for these same years—we will now take a look at spending in other, non-academic sectors.

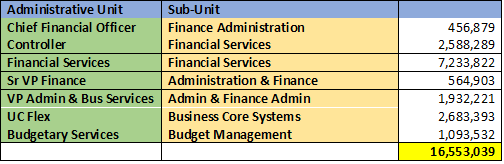
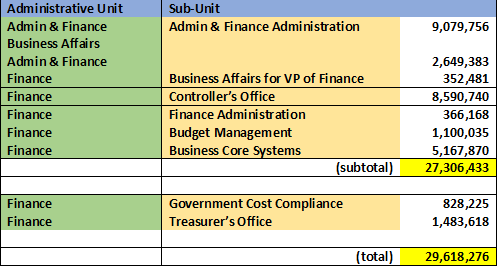
Tracking spending is more challenging in some administrative sectors than others, because they appear in different categories over the years, so a little guesswork is involved. This is especially the case with those sectors having to do with UC’s financial and business operations. Charts I.A. and I.B. detail total spending in the financial sectors in FY09 and FY16, respectively. The different categorizations of the various operations necessitate separate charts, but the intent here is to paint as clear a picture as possible of spending in the University’s business and financial sectors in this time period. In Chart I.B., the sub-units “Government Cost Compliance” and “Treasurer’s Office” are listed separately because they are relatively new and did not appear in any discernable form in FY09. However, they appear to be sufficiently related to the University’s business and finance operations to merit inclusion in the chart.

CHART I.A. – Total Expenditures in the Business and Financial Sectors, FY09[ii]

CHART I.B. – Total Expenditures in the Business and Financial Sectors, FY16 


From FY09 to FY16, total expenditures on the University’s business and financial operations skyrocketed by 79%. A deeper dive into that spending suggests that the majority of that increase is attributable to a rise in operating expenditures, rather than salaries (which still rose by a little over a $1 million from FY09 to FY16). One category of spending in the Administrative and Finance Administration sub-unit of Administration and Finance Business Affairs grew dramatically from FY13 to FY16—“Fundraising Activities.” In FY13, Administration Finance and Business Affairs spent $69,592 (in inflation-adjusted dollars) on “Fundraising Activities.” By FY16, this figure ballooned to $7,331,676—and the entire amount went to the UC Foundation.

Interestingly, the UC Foundation appears on the University’s Schedules sporadically from FY13 to FY16 as a separate category of spending, but in amounts of less than $5,000 per year. There is another category having to do with fundraising activities, named, aptly enough, “Professional Services and Fundraising.” This was once housed in the Alumni Office and became its own separate category starting in FY13. Inflation-adjusted expenditures on “Professional Services and Fundraising” gradually dropped from approximately $12.8 million (in inflation-adjusted dollars) in FY09 to $9.1 million in FY16. So, although spending on “Professional Services and Fundraising” has dropped over this time period, when the expenditures on the UC Foundation are factored in, overall spending on fundraising activities has increased by roughly 25%.

It is not clear at this point why the UC Foundation received over $7.3 million in University funds in FY16. It is an odd juxtaposition, however, with the perpetual budget crunches at the colleges, particularly under the PBB regime, which fundraising ideally should be ameliorating, rather than exacerbating.

[i] “Following the Money: The Big Picture, Part I,” Works, Vol. 24, No. 2, 2 March 2017.

[ii] FY09 dollar figures adjusted for inflation using the CPI Inflation Calculator, https://data.bls.gov/cgi-bin/cpicalc.pl.

—Stephanie Spanja, J.D.
Director of Research, UC Chapter AAUP
Return to top of page.


Performance Based Budgeting, Seven Years Later: Decision-Making Inside the Black Box

It’s probably safe to say that most people see transparency in public institutions as a good thing. When constituents have access to clear, comprehensible information as to how public institutions operate, they are better able to hold public administrators accountable for their decisions.

One of the selling points of Performance-Based Budgeting at UC has been transparency. Through PBB, college revenues and expenditures are determined by using a specific formula, which makes it possible to see exactly how the final dollar amounts were calculated. The virtue of PBB is that it is supposed to leave no room for behind-the-scenes politicking for funding—at least as far as the colleges are concerned. However, there is one aspect of the PBB process which is not transparent: the part in which the decision makers determine how much each college and administrative unit should receive to fund their operations in the coming fiscal year. These decisions are of primary importance, determining how much revenue the colleges are expected to take in to meet those requirements. And yet, as we will discuss, they appear to be made inside the “black box,” where it is unclear exactly who is being consulted, and what specific value judgments have been made.

Moreover, the fact that several aspects of PBB are transparent does not mean that PBB is fair. As we discussed previously, while PBB has an internal logic, it allows for outcomes which are significantly inconsistent across the colleges, with some colleges’ budgets nearly keeping pace with student enrollment increases, while others fall significantly behind.[i]  This is so partly because, again, PBB is a top-down process, in which college budgets are determined without sufficient consideration of the colleges’ actual needs and respective capacities to generate higher revenue through increased enrollments. This has facilitated the gradual redistribution of funding away from colleges and increasingly toward administrative sectors.

The PBB Process: A Brief Overview

The PBB process begins in early fall of each year, when the President and the Provost, “through consultation with the Budget Committee (BC) and other stakeholders,” determine how much money the University will need to operate and the University’s projected revenue for the coming fiscal year.[ii]  The BC is chaired by the Senior Vice President for Finance and Administration, and includes senior administrators within Finance and the Provost Office, as well as the Associate Dean for Medical Operations and Finance.[iii] It is unclear exactly which other stakeholders are consulted, be they Deans or faculty members, or to what extent they have input. This is the “black box” part of PBB, in which the process of determining those needs is not at all transparent, but opaque.

Bear in mind that, in PBB, the colleges are the primary “revenue producers,” i.e., generators of revenue for the University. Other units that support the colleges, but that do not themselves generate revenue, are “revenue supporters.”  This includes administrative units such as the Registrar, Finance, and the President’s Office.[iv]

When the amount of money needed for the University to operate exceeds its anticipated revenue (as it inevitably does), the gap between the two is called a “threshold.”[v]  Through various formulas, a share of this threshold is assigned to each college in proportion to their instructional FTEs, major FTEs, and full-time faculty and staff. Shortly thereafter, each college must present a plan for meeting its share.[vi] This plan may include increasing enrollment (and thus tuition revenues), decreasing expenditures (“cost savings and efficiencies”), or a combination of the two.[vii]  At the end of the fiscal year, if the college actually takes in more revenue than is necessary to meet its threshold, then it will split an undefined, “agreed upon percentage” of that revenue with the Provost office. If a college fails to meet its threshold share, then its budget will be cut.[viii]

It might be easier to see how this works if we imagine a simple example. Say that University Y is comprised of 2 colleges: A and B. Through a PBB process, University Y has determined that it needs $110 million to operate. However, it projects that A and B will only bring a combined total of $105 million in revenue, leaving a $5 million short fall. This $5 million is the threshold. By headcounts of FTEs, full-time faculty and staff, College A is deemed to be the larger of the two colleges (and a larger consumer of University resources, such as administrative support and maintenance). So, College A is assigned $3 million as its threshold share, and College B is assigned $2 million. Colleges A and B now have to submit plans for how they will meet their thresholds, either by cutting budgets or through growth. If they fail to meet their shares, then their budgets will be cut. If they exceed their shares, they will split a portion of the excess profit with University Y.

PBB’s Impact on the Colleges

We have already seen the disparities between increased student enrollments and lagging college budgets, the latter of which is in large part the product of the PBB process.[ix] We have also observed, on the basis of a review of the threshold plans and budgets through FY15, that PBB has had multiple negative impacts on several colleges, including, among others:

  • Discouraging the hiring of full-time faculty and the replacement of retiring faculty;
  • Increased class sizes;
  • Reduced staff support; and
  • Increased student fees for some programs.[x]

When we examine exactly how much the colleges are allocated through the PBB process, in relation to the revenues they generate, it is not hard to see how such outcomes are possible. Indeed, they are necessitated by the PBB model, which is predicated upon assigning each college a threshold share—or built-in budget deficit—that they must climb out of through more revenues or budget cuts.

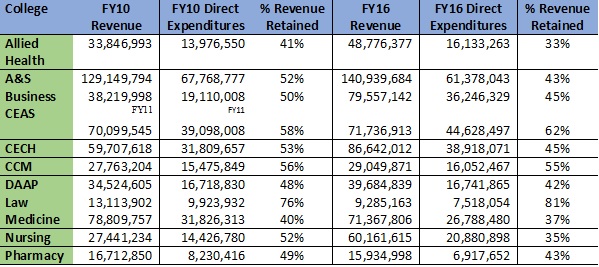
“Direct expenditures” are those portions of revenue from tuition, fees, and State Share of Instruction (SSI) that colleges retain control over. Chart I below shows that, in inflation-adjusted dollars, most colleges retained, or were allowed to keep, smaller proportions of this revenue,  in FY16 as compared to FY10, even adjusting for inflation.[xi] It is important to note that “direct expenditures” here do not include funds derived from other sources, including grants, endowment funding, etc., so the figures below do not correspond with the “Total Expenditures” referenced in the Annual Fund Accounting Schedules.[xii] Nonetheless, the data below is a revealing barometer of the impact of PBB on college operations.

Note that although UC Blue Ash and UC Clermont submit budget plans through the PBB process, they are separately budgeted and thus are not included in the PBB model. Also, data for the College of Engineering and Applied Sciences is provided as of when it was first available, in FY11, following the merger of the College of Applied Sciences into the College of Engineering.[xiii]


Chart I: Total Net Revenues and Direct Expenditures by the Colleges, Compared


More Money for Administrative Sectors

Only two colleges retained a larger proportion of their revenue in FY16 than they did in FY10: CEAS and Law, though in the latter case the dollar amount was actually lower in FY16 than in FY10, due to a market-wide drop in enrollment. Among the majority of colleges which retained less of their revenue in FY16 than in FY11, A&S stands out for a particularly startling result: it sustained not only a percentage drop in the revenue it retained, but also a drop in the actual dollars it retained—despite seeing an increase in its revenue and, as we reported previously, a 25% increase in its FTEs.[xiv]

Chart I suggests that, under PBB, there has been a dramatic redistribution of money away from the colleges and toward various administrative and other support sectors. This is borne out by other data from the Revenue and Cost Templates.

Total net revenues generated by the colleges grew from approximately $545 million in FY10 (adjusted for inflation) to $658 million in FY16, a nearly 21% increase. [xv] However, the amount of revenues that the colleges retained control over as “direct expenditures”, presumably used to directly sustain their operations, only increased by 6%, rising from $281 million in FY10 (in inflation-adjusted dollars) to $298 million in FY16. Meanwhile, revenues used to support the University’s operations (“indirect expenditures”) increased from $266 million in FY10 (in inflation-adjusted dollars) to $359 million in FY16, a 35% increase.

Chart II below displays the changes in indirect expenditures from FY10 to FY16. It is important to note that most colleges’ direct expenditures, as listed in the Revenue and Cost Templates, include spending in several of the categories listed below, although the vast majority are devoted to Instruction, with the next largest category being Academic Support (which includes expenses for Deans’ offices). It is unclear from the Primer what would distinguish an “indirect expenditure” on Instruction from a “direct expenditure.”


Chart II: Indirect Expenditures under PBB

While the largest percentage increase is in Instruction, the largest dollar increase, by far, is in institutional Support, which grew by nearly $36 million dollars from FY10 to FY16, followed close behind by the category “Unassigned,” with a $28 million dollar increase over the same period. Institutional Support is comprised of a long list of administrative units, including the President’s Office, Legal Affairs and General Counsel, University Health Services, Finance Administration, and Human Resources, among several others. It is not yet clear exactly where the  “Unassigned” funds were eventually assigned to and how they were spent; this merits further investigation.

Conclusion

It is reasonable to speculate that, if one were to try to run a University “like a business,” at least in terms of its finances, then PBB would be the budgetary tool of choice. It is profit-driven, concerned with short-term outcomes, indifferent to the particular needs of the sub-units, and provides a conduit for directing more money upward—or at least away from the sectors that generate the revenue, i.e., the colleges. Colleges can’t do their jobs, of course, without administrative support structures. However, whereas 52% of revenues went to the colleges as “direct expenditures” in FY10, by FY16 this proportion dropped to 46%, with the “indirects” taking the rest. This is a significant movement of funding away from the core academic mission.

A robust discussion about the University’s budget priorities should include Deans, Faculty Senate, faculty members at-large, and other stakeholders, and could result in very different outcomes than those under PBB. But for that to happen, the decision-making process about each college’s and administrative unit’s actual needs must be taken out of the “black box” in which it currently exists.

[i] “The More Things Change …: UC Instructional Spending Still Lagging, Despite Increased Enrollment,” Works, Vol. 23, No. 5, 15 Dec. 2016.

[ii] Primer on PBB and the Revenue and Cost Template, Fiscal Year 2017, Revised 3/30/17, available through the Office for Institutional Research.

[iii] http://www.uc.edu/provost/faculty1/committees/Budget_Committee.html, Accessed Web 1 May 2017.

[iv] Primer, supra.

[v] Id.

[vi] Id.

[vii] Id.

[viii] Id.

[ix] “The More Things Change,” supra.

[x] “PBB: The High Cost of ‘Efficiency,” Works, Vol. 22, No. 5, 3 Sept. 2015.

[xi] University of Cincinnati, Revenue and Cost Templates, Fiscal Year 2010 ,Version 9.0, Fiscal Year 2011, Version 4.1 and 2016, Version 4.1. The latest know version of each Revenue and Cost Template was used for this article. Dollar figures for FY10 inflation-adjusted using CPI Inflation Calculator, https://data.bls.gov/cgi-bin/cpicalc.pl.

[xii] See “The More Things Change,” supra.

[xiii] Data for the College of Allied Health Sciences in FY10 includes figures for the then-separately budgeted College of Social Work, which was merged completely into Allied Health the following year.

[xiv] “The More Things Change,” supra.

[xv] University of Cincinnati, Revenue and Cost Templates, Fiscal Years 2010 and 2016; dollar figures for FY10 inflation-adjusted using CPI Inflation Calculator, https://data.bls.gov/cgi-bin/cpicalc.pl.

—Stephanie Spanja, J.D.
Director of Research, UC Chapter AAUP
Return to top of page.


Intellectual Property Law Raises Questions about Copyright of Faculty Work, Online Courses


The AAUP-UC Chapter receives a number of questions from faculty about copyright ownership of their academic work product, especially with regard to online or distance learning. This is undoubtedly a reflection of the recent explosion of distance learning across UC, and the involvement of outside entities in distance learning endeavors (by marketing or recording on-line courses, or by possibly playing some role in their development). Faculty want to know: when I upload my course materials to Blackboard (or some other online platform), do I still own those materials?


Here, we present a basic overview of copyright law, a discussion of the national AAUP’s position regarding copyright ownership in academia, and a review of UC’s policy on copyright ownership. We’ll provide a full review of this complex and evolving area of law, and recommendations for faculty engaged in distance or online learning, in a Staff Advisory Letter which will be issued at the beginning of the Fall Semester.


Copyright Law and Faculty: The Basics


The Copyright Act of 1976 “protects original works of authorship fixed in any tangible medium. See 17 U.S.C. § 102. This includes books, private letters, paintings, computer programs, motion pictures and other audiovisual work. It also includes anything else fixed, no matter how it is fixed … [such as] web pages [and] notes on a scrap of paper.” (Works, 15.8, 1 Dec. 2008, “Copyright in Academia,” p. 1.) As noted in that article, copyright can be asserted once the work is fixed in a tangible medium, and registration [of the copyright] is not necessary to create the copyright protection. The holder of a copyright owns not only the work, but the right to control its use, including the right of reproduction, translation, abridgment, revision, public distribution, public performance and display.


One statutory exception to these basic rules of copyright ownership is the “work-for-hire” doctrine, which entitles an employer to assert ownership of materials prepared by its employees acting within the “scope of their employment.” The “work-forhire” doctrine has been in existence since the 1909 Copyright Act. However, the work-for-hire exception had its own exception under the common law: the “teacher’s exception,” under which “work-for-hire had not applied to faculty members’ academic writings.” (Garon, Jon. “The Electronic Jungle: The Application of Intellectual Property Law to Distance Education, 4 VAND. J. ENT. L. & PRAC., 146, 152, (Spring 2002)).


Since the Copyright Act of 1976 was established, the continued existence of a “teacher’s exception” under the law is seriously in doubt, at best. However, the justification for such an exception in practice continues to be valid, as not only asserted by the National AAUP, but also reflected in the fact that numerous institutions, including UC, expressly disclaim copyright ownership of most works created by faculty (as well as those by staff and students).


The National AAUP’s Position on Faculty Copyright Ownership


In its 1999 Statement on Copyright, the National AAUP noted:


the prevailing academic practice [of treating] the faculty member as the copyright owner of works that are created independently and at the faculty member’s own initiative for traditional academic purposes. Examples include class notes and syllabi; books and articles; works of fiction and nonfiction; poems and dramatic works; musical and choreographic works; pictorial, graphic, and sculptural works; and educational software[.]


The Statement distinguishes the traditional employer-employee relationship for which the “work-for-hire” exception is tailored (in which the employer directs the form and content of the material produced) from the environment in which “traditional academic works” are produced, in which “the faculty member rather than the institution determines the subject matter, the intellectual approach and direction, and the conclusions.” As the Statement affirms: “This is the very essence of academic freedom.”


Copyright and University Policy


UC has expressly disclaimed copyright ownership of “traditional works” in Board Rule 10-19-02(B)(1):


The policy does not change the traditional relationship between the university and authors of textbooks and other scholarly and artistic works. Unless the production of such materials is subject to paragraphs (B)(2) to (B)(4) of this rule, the university disclaims ownership of copyrights in textbooks, monographs, papers, articles, musical compositions, works of art and artistic imagination, unpublished manuscripts, dissertations, theses, popular nonfiction, novels, poems and the like that are created by its faculty, staff and students.


The three exceptions to this Rule are:


  • Externally sponsored works. In such cases, copyright ownership is determined “as part of the ordinary contracting process that relates to externally sponsored projects.” (B)(2)
  • University sponsored works. In subsection (B)(3) of the Board Rule, UC claims copyright ownership over materials specifically produced as “works-for-hire,” including “works created as a result of specific assignments; works supported by a direct allocation of university funds for the pursuit of a specific project; and works that are specially commissioned by the university. However, (B)(3) makes expressly clear that:


A faculty member’s general obligation to produce scholarly works does not constitute a specific university assignment, nor is the payment of regular salary, the use of office and library facilities, or the production of incidental clerical support or reasonable data and word processing considered a direct allocation of university funds or the purposes of this [subsection].


  • University supported work. In subsection (B) (4), UC “claims copyright to works produced with significant use of its resources,” or, in other words, “resources that exceed the normal amount of resources available to faculty, staff and students for the performance of their normal functions.”


Faculty work product such as course design, course syllabi and lecture notes do not fall within any of the above exceptions, since they are not externally sponsored (with rare exceptions). Rather, they are the product of faculty members’ typical workload (not special or unusual assignments), and do not typically involve the “significant use of [University] resources.” Thus, course design, syllabi and lecture notes would be expected under the University’s Board Rules to be “owned” by the faculty member.


Copyright and Distance Learning


From one perspective, on-line instruction is simply another modality of delivering course content. In that light, then, the principles of copyright ownership that apply to course syllabi, lecture notes and materials in a traditional brick-and-mortar course should similarly apply in distance learning courses. However, the national AAUP, in its 1999 Statement on Distance Education, has noted that “systems of interactive television, satellite television, or computer-based courses and programs are technologically more complex and expensive than traditional classroom instruction, and require a greater investment of institutional resources and more elaborate organizational patterns.” In cases where a university has simply supplied the “delivery mechanism” for on-line content (such as “video-taping, editing and marketing services”), “it is very unlikely that the institution will be regarded as having contributed the kind of ‘authorship’“ that would “[entitle] it to a share in the copyright ownership.”


However, the National AAUP noted, an “institution may, through its administrators and staff, effectively determine or contribute to such detailed matters as substantive coverage, creative graphic elements, and the like; in such a situation, the institution has a stronger claim to coownership rights” [emphasis added] and “it is not likely that a single principle of law can clearly allocate copyright-ownership interests in all cases.”


While the National AAUP statement does not supplant or otherwise modify the faculty’s right to control curriculum per Article 27.2 of the AAUP-UC Collective Bargaining Agreement, the reality is that online or distance learning has exploded since the AAUP issued its 1999 Statement, and recent legal decisions have begun to hammer out—or in some cases make more murky—those very questions raised about technological complexity some 15 years ago.


—Stephanie Spanja, J.D.
Director of Research, UC Chapter AAUP
Following the Money

  • Click here to read the President’s Corner
  • Click here to read Following the Money
  • Click here to read PAC Update
  • Click here to read AAUP Summer Institute at UC

President’s Corner

Let’s review the state of academia here at UC and in the US.

Nationally, President Trump and his advisors continue to mull over a “revised” executive order prohibiting the entry of Syrian refugees and travelers from seven other predominantly Muslim countries. This has led to fear, confusion, and uncertainty among many faculty and the over one million foreign students currently enrolled in the U.S. higher education system.

The president has also appointed a secretary of education who made millions dollars off the privatization of education and whose primary focus has been to dismantle the public education system that she now oversees.

In Iowa, there has been a bill introduced in the legislature that examines political affiliation as part of the hiring process. In a separate Iowa bill, faculty would be prohibited from bargaining over health insurance, staff cuts, and evaluations. Faculty could only bargain over wages and that would be limited to increases of 3% or the local consumer price index—whichever is lower.

In North Carolina, there has been a push to require faculty to “reflect the ideological balance of the state”. While this issue has been tabled, we’ve certainly witnessed other egregious bills passed in NC.

In Ohio, signs of trouble lurk around the General Assembly. The House has inserted language in the state budget bill that would require all public universities to review their tenure policies. Rep. Ron Young has introduced a bill that would create a state-imposed workload mandate for tenured faculty. And Rep. John Becker has once again reintroduced “Right –to-Work-for-Less,” aiming to curb unions from collecting fair share fees from non-members, even though it has been clearly established that this type of legislation is nothing more than political posturing.

Here at UC, the fight hits home. We continue to see spending on instruction reduced, reliance on adjunct faculty increase, and the harsh impacts on the core academic mission of performance based budgeting, which focuses on quantity over quality. Couple that with a ballooning athletic subsidy and a skyrocketing tuition burden for students and you have a recipe for disaster. For a deeper dive, I implore you to take a moment to read the Ohio Conference AAUP’s 2017 Ohio Education Report. In it you will find various factors that negatively affect public universities along with common sense reforms and solutions that will refocus Ohio’s education policies and procedures.

Make no mistake, these are dark times. Individually we will have no chance of successfully resisting these forces which are threatening higher education. We can and will only have an impact if we work together. The AAUP was formed in response to threats to higher education. Unfortunately, the threats we now face are far greater in scale and magnitude.

If you are a member, I encourage you to get active, get involved. If you’re not a member, join the AAUP today! Although the difference between a fair share fee and actual membership is minimal, the impact of membership is dramatic. Only together can we oppose these unfair, unwise, and unjust policies. Together we can find solutions, protect higher education, and maintain universities as a safe harbor for thought and a model for the rest of society.

Yours,

Ron Jones, President

AAUP-UC Chapter


Following the Money: The Big Picture, Part I

Tracking spending at UC is an unavoidably complex endeavor, given that UC is a sprawling, multifaceted institution, comprised of 13 colleges, a large library system, multiple (and expanding) administrative units and, of course, its intercollegiate athletics program. Adding to this complexity are multiple possible modes of inquiry, from the macroscopic to the granular, all of which have their merits. For information to be useful, however, it must be digestible. With that in mind, we are going to look at spending at UC in a series of focused snapshots. We will lay the foundation for this series with this first “snapshot,” an overview of spending at the colleges and the library system. In subsequent installments, we will look at spending on administration (a particularly challenging task given that administrative units are continuously reorganized), athletics, and on various categories (such as travel, distance learning, office supplies and furniture, etc.). Finally, we will examine the impact of Performance-Based Budgeting on college budgets and on spending throughout the University.

Our starting point is Fiscal Year 2008-2009 (FY09), which preceded both the dramatic, years-long rise in student enrollment at UC that began in Fall 2009, and the implementation of Performance-Based Budgeting, also in Fall 2009. As the following charts show, at most colleges, student enrollment (full-time equivalent, or FTE) rose significantly while spending failed to keep pace. Some colleges—and some Deans’ offices—fared better than others, however, which is a likely byproduct of the idiosyncrasies of Performance-Based Budgeting.


Chart I:  FTEs and TOTAL EXPENDITURES, FY09-FY16, by COLLEGE, WITH LIBRARY

Chart II:  TOTAL EXPENDITURES, DEANS’ OFFICES, FY09-FY16


The College of Nursing does not appear in the above chart because it presents a unique case where, beginning in FY12, spending on functions typically housed in a Dean’s Office appears to be dispersed among several different offices. This is suggested by significant fluctuations in spending attributed to the Nursing College Office ($473,168 in FY15, jumping up to $1,590,347 in FY16) and corresponding jumps in spending in other units, such as Administration (created in FY13) and the Institute for Nursing Research (where spending jumped from $250,822 in FY13 to $2,191,272 in FY14, and continued to grow from there). So, looking at spending at the College of Nursing “in reverse” may be helpful. In FY09, spending on “Academic Nursing,” where the instructional mission is apparently housed, comprised 65.3% of total expenditures at the College of Nursing. In FY16, the proportion of spending on “Academic Nursing” increased to 67.4%, a small increase but an increase nonetheless.


THREE TAKEAWAYS:

  1. COLLEGE BUDGETS HAVE NOT RISEN IN PROPORTION TO INCREASES IN FTES

There is no direct percentage correlation between growth in FTEs and increases in college budgets. For example, at Arts & Sciences, FTEs rose by nearly 25% over the course of eight years, but the college budget increased by only 5.8%. In fact, among the majority of colleges where FTEs increased, only the College of Nursing’s budget growth outpaced its growth in FTEs. Among the rest, there were significant variations. At the College of Business, for example, FTEs grew by over 50%, while its expenditures grew by 38.2% from FY09 to FY16. Over the same time period, however, A&S saw a nearly 25% increase in FTEs, but only a 5.8% rise in its expenditures. At CCM, expenditures actually decreased, by 8.8%, while its FTEs grew by 6.6%.

At two colleges—Law and UC Clermont—FTEs dropped from FY09 to FY16. With respect to Law, FTEs peaked at 430 in Fall 2010; its subsequent drop corresponds with a nationwide plunge in law school enrollment over the past five years. As we have reported previously, Clermont’s FTEs similarly peaked at 2,829 in Fall 2011, and steadily dropped since then, reflecting the unique impacts of the Great Recession and recovery (with improved employment prospects among potential students). See “The More Things Change …: Instructional Spending Still Lagging, Despite Increased Enrollment,” Works, 15Dec2016.

  1. DEANS’ OFFICE BUDGETS VARY WIDELY, IN DOLLAR AMOUNTS AND IN PROPORTION TO TOTAL COLLEGE BUDGETS AND FTES

When looking at Deans’ office spending, it is important to qualify Chart II by noting that, at some colleges, student financial aid comprises a significant portion of Deans’ office budgets. For example, at UC Blue Ash, student financial aid makes up approximately two-thirds of the Dean’s office budget, at the College of Business, roughly one-quarter of the Dean’s office budget goes toward student financial aid, and at the Law School, nearly one-half of the Dean’s Administration budget goes toward student financial aid. Even subtracting amounts spent on student financial aid, there were still significant differences in spending among Deans’ Offices in FY16, especially in juxtaposition with student FTEs. For example:

  • College of Business Dean’s Administration: $2,843 per FTE.
  • CECH College Office: $2,294 per FTE.
  • UC Blue Ash: $1,215 per FTE.
  • Arts & Sciences College Office: $702 per FTE.
  1. SPENDING ON UNIVERSITY LIBRARIES HAS SIGNIFICANTLY DROPPED IN PROPORTION TO FTES

In Fall 2008, total UC FTEs were 29,593, and total University Library spending per FTE in FY09 was $760. By Fall 2015, UC FTEs had jumped to 34,421, but total University Library spending per FTE in FY15 dropped approximately 20%, to $600 per FTE. A reduction in Library spending seems incongruous not only with the numbers of FTEs but also with UC’s status as a Research I institution, and merits further investigation.


PERFORMANCE-BASED BUDGETING: BUDGETING DOES NOT APPEAR RELATED TO PERFORMANCE

As we have discussed in the past and will revisit in future articles, the Performance-Based Budgeting system has its own internal logic, such as it is, according to which budgets are supposed to be set in relation to a set of formulas, and the goal is a transparent distribution of resources. While the formulas are largely transparent, at least in respect to the colleges (and leaving aside administrative units), the results appear inequitable, when one steps outside the PBB box and looks at the colleges’ spending from the above perspectives. Moreover, the wide variation in spending on Deans’ offices—and the particularly high spending per FTE in some—begs the question as to whether upper Administration exercises the same oversight of it as it does of instructional spending. We’ll address that question further in future articles, when we look at operating expenditures on a granular level.


CONCLUSION

In the next “Snapshot,” we will look at spending at various administrative units across the University. As mentioned above, this is particularly challenging, given that administrative offices appear under different headings over the years. From there, we will proceed to a granular look at operating expenditures, to see where exactly the money is going. In several cases, the results may be eyebrow-raising, to say the least.


—Stephanie Spanja, J.D.
Director of Research, UC Chapter AAUP



AAUP-UC Political Action Committee Update

In the wake of recent U.S. Presidential Cabinet appointments and legislative proposals at the National and State level, we face a difficult and frightening time for faculty and for higher education in America. At the federal level, President Trump has appointed Betsy DeVos, who has a long history of not supporting public education, as Secretary of Education. He has also named evangelical leader and president of Liberty University Jerry Falwell, Jr. to lead a task force to reform higher education.
At the state level, Iowa and Missouri have introduced bills that would eliminate tenure. Iowa has also introduced a bill that would make faculty hiring decisions based on political party affiliation.

Ohio, not to be outdone, has introduced House Bill 66 (HB 66) that would create state-imposed workloads for tenured faculty. The bill specifically would require that tenured faculty teach “not less than three semester hours, or the equivalent, of undergraduate courses per semester.” Ohio has also introduced a bill that would add “commercialization” as a requirement of tenure.
Right to Work bills for private and public sector employees have also been introduced in the Ohio house. Right to work legislation would prevent unions from collecting fair share fees for non-members. It creates free-riders: employees who receive all the benefits of union membership while not contributing to its support. The purpose of Right to Work is to weaken collective bargaining and erode public employee salaries and benefits.

The news is foreboding, but not entirely dark. People are joining together with unprecedented energy to oppose these and others initiatives. Through the Chapter’s Political Action Committee (PAC), we are working with our allies on several critical responses. In conjunction with the Ohio Conference of the AAUP, the PAC is scheduling lobbying days in Columbus to meet with state representatives to discuss the blatant problems with Ohio HB 66 and other issues of import to higher education. Contact Jeff Cramerding if you are interested in participating.
The Ohio Conference has also released its 2017 Ohio Higher Education Report “Education First,” which calls for universities to re-focus on their traditional teaching and research functions. The report is being sent to lawmakers, journalists, boards of trustees, and other stakeholders.

The PAC is also hosting a Solidarity lunch with student groups and other campus unions on March 27th from noon until the food runs out on McMicken Commons. There will be a roundtable discussion on the current politics of higher education.

Faculty active in the PAC are also working to organize a Cincinnati March for Science on April 22nd, with the same platform as the National March for Science. Details will be forthcoming. Contact Julie Weast if you’d like to be involved.

Finally, AAUP-UC is currently soliciting proposals from Cincinnati-area nonprofits for a Summer Graduate Internship, with preference given to work on social and economic issues. The Internship will be expected to run from mid-May through early August, and the Chapter will provide $4,000 for an intern to engage in research or fieldwork for approximately 20 hours per week.
We must remember that our actions and our voices still matter. We can still use the power of our collective bargaining to uphold the rights and voices of our students, and to fight for quality public education. If you would like to join the PAC and help us with our mission, please contact me or Jeff Cramerding.

–Phoebe Reeves
PAC Chair


AAUP-UC Chapter Selected to Host 2017 National AAUP Summer Institute

Today, the National AAUP and AAUP Collective Bargaining Congress (AAUP-CBC) announced that the University of Cincinnati has been selected as the location for the 2017 Summer Institute on July 27–30. The Summer Institute is cosponsored by the AAUP and AAUP-CBC. It is the “premier training program for faculty advocates, and one of the best sources available for learning the practical skills that faculty unionists need to build their organizations and run them successfully.”

Every year, hundreds of faculty members from around the country attend Summer Institute to learn about AAUP policies, discuss the issues facing the academy, sharpen their skills as union leaders, and develop strategies for organizing.

According to Chapter President Ron Jones, “The AAUP-UC Chapter is proud that UC has been selected for the event, and it’s a recognition of the strength of the Chapter and the role we play in the AAUP in Ohio and nationally.” More information on how to register for the Summer Institute will be sent to AAUP members in the coming weeks.

–Eric Palmer, J.D.
Executive Director

Starving the Beast

President's Corner
  • Click here to read the President’s Corner
  • Click here to read Postponing Academic Leaves: How Does That Work?
  • Click here to read the Northern Kentucky University “Starving the Beast” Film Screening and Panel

President’s Corner

The following Op-Ed, co-written by AAUP-UC Chapter President Ron Jones and Ohio Conference AAUP President John McNay, appeared in the Cincinnati Enquirer on January 23rd, and is available to read online here.

On January 7, extreme Kentucky legislators passed right-to-work legislation. Such legislation has been brought forth locally by West Chester Township trustees, and also was touted in a recent op-ed in the Enquirer, which suggested that Ohio should enact a statewide right-to-work law. A more thoughtful analysis shows that right-to-work would be very wrong for Ohio.

Right-to-work advocates want you to believe that workers are “forced” to join a union as a condition of employment. Like the author of the Enquirer op-ed, those who perpetuate this myth know that it is false and misleading. In Ohio and nationally, all employees are free to join or not join a union. Unions are, however, required by law to represent everyone in the collective bargaining unit, and are permitted to collect “fair share” fees from workers who choose not to become members. Without fair share fees, some workers would become “free riders,” able to enjoy the benefits won by the union for free while their fellow employees subsidize them. That’s not fair.

There is little evidence that right-to-work does anything to help communities or attract businesses. On the other hand there is much evidence that right-to-work lowers wages and leads to unsafe working conditions. The average worker in a right-to-work state makes $500 less per month than those in non-right to work states. Work place deaths are 49% more likely. Further, the poverty rate is 15% higher and health benefits are 13% lower in right-to-work states. It is clear that RTW undermines quality of life.

Unfortunately, too many extreme Ohio politicians are eager to make the Buckeye State look like Mississippi or Arkansas, when we ought to be striving to be more like California, the world’s sixth largest economy. California is a state driven by strong infrastructure, skilled union labor, and high levels of education. Those are the keys to success.

If the people of Kentucky had the right to repeal the bad legislation imposed on them, they certainly would, just as the people of Ohio repealed another anti-worker provision in 2011, Senate Bill 5.

It is ironic that these assaults on working people are occurring around the holiday marking the life of Rev. Martin Luther King, Jr. King was right when he said: “In our glorious fight for civil rights, we must guard against being fooled by false slogans, such as ‘right to work.’ It is a law to rob us of our civil rights and job rights. Its purpose is to destroy labor unions and the freedom of collective bargaining by which unions have improved wages and working conditions of everyone…Wherever these laws have been passed, wages are lower, job opportunities are fewer and there are no civil rights. ”Ohio needs common sense legislation to help middle class families–like a living wage, affordable healthcare, investment in infrastructure, and a real strategy to attract quality jobs—to help middle class families. We need to have as much concern for the employee as we do for the employer. Don’t be fooled. Right-to-work is wrong for the working and middle class, wrong for Ohio, wrong for all of us.


Ron Jones, President
AAUP-UC Chapter

John McNay
President, Ohio Conference AAUP


sabbatical Postponing Academic Leaves: How Does That Work?


A new provision in the 2016–2019 Collective Bargaining Agreement (CBA) allows for the postponement of an approved academic leave, either at the request of the faculty member or at the request of an Academic Unit or College. With decisions on requests for academic leaves likely in the pipeline, we thought it would be a good idea to review these new rules in Article 25.8, so that if the question of postponement comes up, you can make an informed decision.

The most common reason for a postponement of an academic leave is that several other faculty members in an Academic Unit would also be on leave at the same time, leaving the Unit shorthanded. This reason often dovetails with “financial considerations” (e.g., there is no money in the budget to hire enough adjunct faculty to cover classes). As with previous contracts, “financial considerations” cannot be the sole factor on which a decision to grant or deny an academic leave is based. However, under the new contract, “financial considerations” could be the basis for a postponement—but not a denial altogether. (We have seen some confusion on that point already, so it bears emphasis here.)

Here’s how the process works, step-by-step:

  • Postponement of an academic leave is an option only if your academic leave has been approved. In other words, if you don’t apply for academic leave because several other faculty members are applying as well, that is not the same thing as a postponement of your leave. So, you must first apply for, and be approved for academic leave.
  • If your academic leave has been approved, either you, your Academic Unit or your College may request that your leave be postponed.
  • If the faculty member has requested the postponement, the maximum amount of time that a leave can be postponed is one academic year beyond the period initially approved as the leave period. So, as the example in the contract states, “an academic leave approved for Fall Semester may be requested to be postponed until the following Fall Semester.” Article 25.8.
  • If the Academic Unit or College has requested the postponement, the maximum amount of time that a leave can be postponed is typically one academic year beyond the period initially approved as the leave period. However, it can exceed one academic year, but only with “the consent and agreement of the Faculty Member.” Article 25.8.
  • If you, the faculty member, want to request postponement:
    • You should address the request first to your Academic Unit.
    • If your Academic Unit approves, then your request will move to the Dean’s office.
    • If the Dean approves, then your academic leave will be postponed.
    • If you do not take your leave within one academic year of the period that you were approved for, then your leave will be cancelled.
  • If your Academic Unit or College requests postponement:
    • The Dean must approve the postponement.
    • The postponement can’t exceed one academic year without the consent and agreement of the Faculty Member.
    • The duration of the postponement shall count towards your eligibility for your next academic leave. In other words, say that you were approved for academic leave for Fall 2017, and it was postponed for one academic year at the request of your Academic Unit, so you take the leave in Fall 2018 instead. In this circumstance, the academic year 2017-2018 will count toward your eligibility for your next academic leave. This is the key distinction between postponements requested by Faculty Members and those requested by the Academic Unit or College. If a Faculty Member had requested this postponement, then the clock for eligibility for the next sabbatical wouldn’t start running until after Fall 2018.


As always, if you have any questions about this or any other section of the CBA, please email the AAUP-UC Chapter office at aaupuc1@ucmail.uc.edu or call the Chapter office at 556-6861 and we will be happy to assist you.


beastNorthern Kentucky University “Starving the Beast” Film Screening & Panel

On February 13th at 6:30 p.m. Northern Kentucky University will host a special screening and panel discussion of “Starving the Beast,” a documentary that examines the consequences for higher education as public funding is cut.

The film’s website describes “Starving the Beast” as follows:

“As college tuition skyrockets and student debt explodes, a powerful new documentary reveals a nationwide fight for control of the heart, soul and finances of America’s public universities.

Starving the Beast tells the story of a potent one-two punch roiling public higher education right now: 35 years of systematic defunding and a well-financed market oriented reform effort. It’s the story of a little known and misunderstood ideological fight, the outcome of which will change the future of public higher education.”

The panel will be moderated by Mark Canan from WCPO. Panelists will include:

  • Karen DePauw, Vice President and Dean for Graduate Education, Virginia Tech
  • Bill Muse, former President of the University of Akron, Auburn University, and Chancellor at East Carolina University
  • Makese Motley, Program Manager and Assistant Director at the American Association of State Colleges and Universities

More information about the film is available at film’s website here.

The event will take place in the NKU Student Union Ballroom. There is no fee to attend, but event organizers ask that you RSVP at the following link:

https://nku.eventsair.com/starvingthebeast/feb13

The event is open to the public and is sponsored by the Office of the Provost and the Scripps Howard Center for Civic Engagement.