Where Is the Money Going? An In-Depth Look at University Expenditures (Part I of II)
Click here to jump to the President’s Corner
Click here to jump to the PAC Report
In a series of articles over the past few years, the UC Chapter AAUP has examined the Administration’s spending in “big picture” terms. We have looked at several categories of spending that appear in the University’s financial schedules, focusing on Instruction, Academic Support, and Institutional Support, to identify trends in spending. This macroscopic view is important, and provides a quick and easily digestible snapshot of where the University’s resources are being directed. On occasion, we have also examined the Administration’s spending on a “micro” level, taking close looks at spending on intercollegiate athletics (e.g., “The Athletics Budget: The True Cost of Playing the NCAA Game,” Works, Vol. 20, No. 3, 27 Mar 2013) and at spending on Academic/Upper Administration salaries and fringe benefits across college offices and selected administrative units (“UC Budget Priorities: An Examination of Administrative Costs,” Works, Vol. 20, No. 3, 27 Mar 2013).
Athletics spending and Administrators’ compensation are only two pieces of the spending puzzle; the question “Where is the money going?” has multiple answers. One area that we have not yet devoted attention to is the University’s operating expenditures. “Operating Expenditures” is one category of spending listed in the University’s schedules to its financial audits, alongside “Salaries,” “Fringe Benefits,” “Capital Expenditures,” “Student Financial Aid,” and “Other Expenditures.” The schedules indicate the total amounts of money that each administrative and academic unit has spent in each category, but do not provide more specific detail on exactly how the money is being spent.
Through a public records request, the UC Chapter AAUP obtained a detailed breakdown of operating expenditures for each administrative and academic unit for the fiscal years (“FY”) 2009 through 2014. Each category of expenditure is indicated by a “General Ledger” code (“GL code”). There are hundreds of GL codes, covering every conceivable type of expenditure related to the day-to-day functioning of an office, from “Travel” of various kinds to “Office Supplies,” from “Fuel-Oil” to “Telephones,” from “Postal Fees” to “Studio Rental,” and everything in-between. While tracing spending over time in every GL code across all the units is not practical and may be of limited utility, a look at selected GL codes that appear to be commonly used among numerous administrative and academic units is illuminating, and in some cases reveals significant disparities across colleges, academic departments, administrative units and, of course, intercollegiate athletics.
The following is the first in a two-part series in which we examine University spending from the macro to the micro level. In this part, we start with an examination of trends in spending across the categories of “Instruction,” “Academic Support” and “Institutional Support,” and then compare expenditures across colleges and administrative units. This provides the necessary context for our look at selected GL-coded “Operating Expenditures” across the University, a glimpse of which concludes this part of the two-part series.
University Spending—The Big Picture
In our two-part series “Education on the Cheap: Devaluing Students and Faculty” (Works, Vol. 22, No. 3, 30Mar2015 and Works, Vol. 22, No. 4, 27 May 2015), we took note of UC’s massive enrollment increase over the past half-decade. In Fall Quarter 2008, UC’s student FTEs (“full-time equivalents”) totaled 29,593. Beginning with Fall Quarter 2009, UC’s enrollment began to increase, at first sharply and then robustly, over the next several years, reaching 33,690 FTEs by Fall Semester 2013.
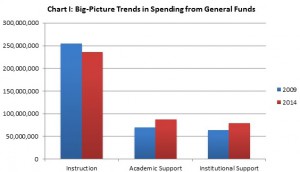
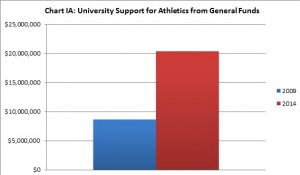
At the same time, the University’s unrestricted revenues grew from $841.6 million in FY2009 to $945.4 million in FY2014 (in inflation-adjusted dollars), a 12% increase driven in significant part by a 33.8% increase in revenues from tuition. However, spending on Instruction from unrestricted general funds actually declined by 7.7%.[i], while spending on Academic Support from unrestricted general funds increased by 25% and spending on Institutional Support grew by 24%. (Chart I) Over this same time period, the Administration increased support for Athletics from $8.6 million to $20.3 million. (Chart IA)
In the big-picture sense, then, spending on Instruction—the University’s core academic mission—has dropped while administrative sectors have seen increases in funding, and Administration support for Athletics has more than doubled. That’s one of the answers to the question “Where is the money going?” but it is the most general answer, and at this point, it’s hardly news to most. Let’s dig a little deeper and look at what’s happening at the college level, and also take a look at spending across some administrative units. Because several administrative units were not identified in consistent terms in the University’s schedules covering FY09 through FY12 (particularly those related to budget management, student affairs and enrollment management), we are focusing on those which are clearly identifiable.
Trends in College and Library Spending
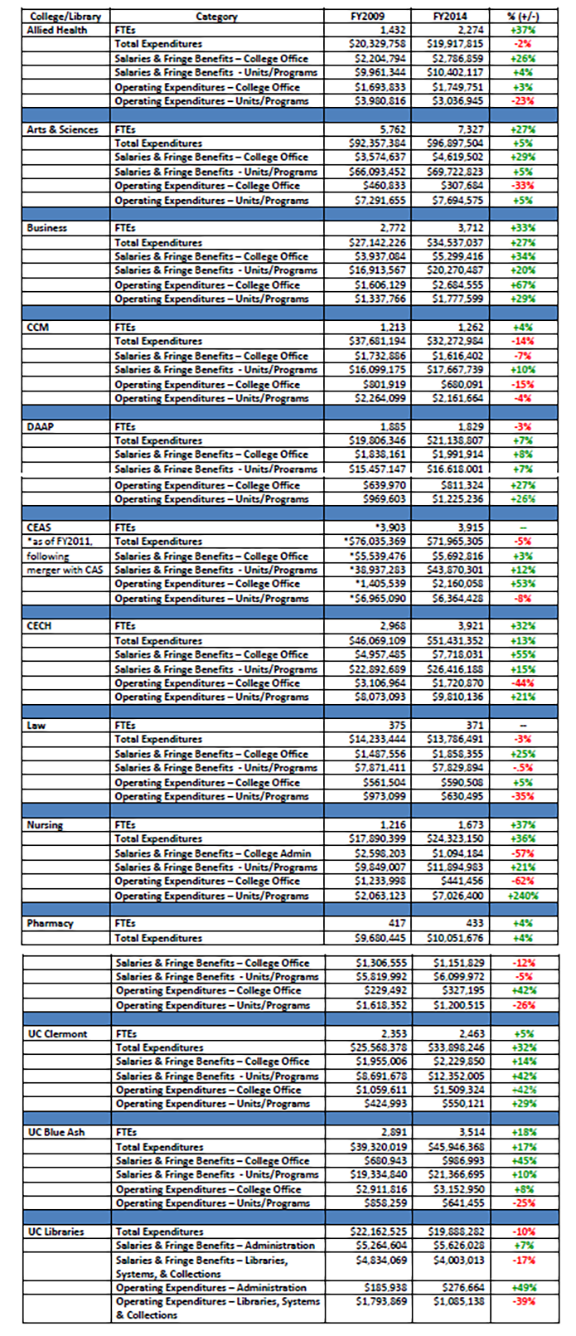
Chart II shows the inflation-adjusted expenditures in UC’s colleges and in UC’s Libraries (except for the College of Medicine, which is unique among the colleges for its heavily-grant driven revenue stream and expenditures). Please note that the categories of spending—“Total Expenditures,” “Salaries and Fringe Benefits,” and “Operating Expenditures”—reflect expenditures from both unrestricted funds (general funds) and other funding sources, including restricted funds and government contracts. The financial schedules do not indicate which source(s) are used to fund a given expenditure. Nonetheless, much of the information on Chart II largely reflects the trends we have identified in our previous articles, e.g., expenditures have largely failed to keep pace with increases in FTEs, and college offices often fare better than academic units.
Here are some notable takeaways from Chart II:
- Total expenditures kept pace with (or exceeded) the growth in FTEs in only four colleges: DAAP, Nursing, Pharmacy and UC Clermont.
- Although FTEs grew at Allied Health and CCM, total expenditures actually decreased at those colleges.
- Spending on Salaries & Fringe Benefits for College Offices or Administrations increased at a faster pace (and in the case of some, significantly so) than for academic units and programs at over half of colleges (and library) on the list: Allied Health, A&S, Business, CECH, Law, UC Blue Ash and UC Libraries.
- There is considerable variation across the colleges and UC Libraries with respect to changes, up or down, in operating expenditures for college administrations and academic units, to the extent that is not possible to identify any particular trends.
The drastic drop in expenditures on the college office and administration in the College of Nursing appears anomalous on the surface. However, this may reflect a reallocation of administrative expenditures among other units within the college, such as the Institute for Nursing Research. Total expenditures for the Institute for Nursing Research ballooned from approximately $250,000 in FY 2013 to nearly $2.2 million in FY2014; approximately $1.35 million of that amount was directed to “academic support,” a category that typically includes Deans’ offices and other administrative functions.
Trends in Spending on Some Administrative Units and in Athletics
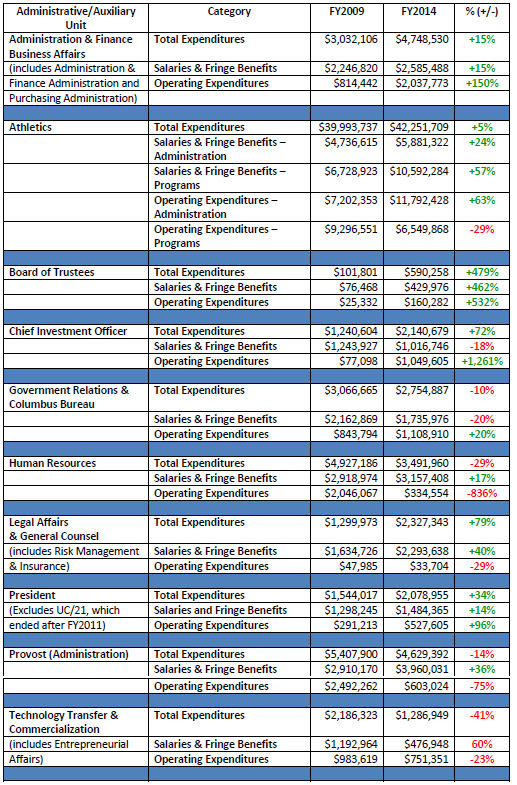
Although Chart III does not show spending trends in all administrative units, but rather a cross-section which includes several major offices in upper administration, as well as those sectors which would appear to play an important role in advancing the University’s interests with government and in industry. One caveat: while there are multiple administrative units related to the University’s financial operations, they are not identified in a consistent manner across the financial schedules until FY2013. Therefore, Chart III reflects data for the most clearly and consistently identifiable financial office across the Administration. In a future article, we will update this chart with additional information in order to provide a more complete picture of expenditures as they relate to the University’s financial offices and functions, which comprise a significant part of the University’s expenditures as relates to Institutional Support.
Chart III indicates that, while spending on “Institutional Support” has indeed increased significantly over a relatively short period of time, it has not increased evenly across the board. The “administration” is not a monolith, but rather, as with the colleges, some sectors fare better than others. While expenditures for several administrative units have increased significantly, they have declined for others, such as Technology Transfer and Commercialization, as well as for the University’s Government Relations offices. The decline in funding for these two offices in particular is puzzling, given that one of the stated missions of the former (which houses the University’s Intellectual Property Office) is to “leverage the considerable, existing research and educational assets in order to establish UC as the premier, comprehensive program for entrepreneurship in the region and nationally”, (http://www.ipo.uc.edu/index.cfm?fuseaction=home.mission, accessed Web 5 Nov 2015), while the Government Relations and Columbus Bureau presumably would be interacting with state legislators who hold the purse strings for higher education.
Finally, while the overall percentage growth in expenditures on Athletics is relatively modest, the Administration has more than doubled its support for Athletics over the same time period, so that “nonmandatory transfers” from general funds and other allocations comprise nearly half of Athletics’ $42.2 million expenditures for FY2014.
Operating Expenditures: Getting Down to the Nitty-Gritty
Progressing from the macroscopic to a more microscopic view, we now turn to the University’s operating expenditures. As we indicated above, there are General Ledger codes (“GL codes”) for literally hundreds of categories of operating expenditures. Chart IV is a list of GL coded-operating expenditures that we will begin to review in this article and go into further detail in the next. We have selected these particular codes because they arguably are indicative of the quality of life across the University’s various colleges, academic units and administrative (and auxiliary) enterprises. The numbers suggest that this quality of life can vary dramatically from college to college and unit to unit, and significantly impact faculty members’ professional lives. By highlighting these categories and the various amounts spent by colleges and units, we are not necessarily challenging the idea that colleges and units have discretion to spend their budgets. For example, we don’t question that a Dean’s office may need to host an event that requires refreshments, or that it might be appropriate for Athletics to bestow awards upon its athletes. However, the extent of such expenditures, placed in the overall context of the budgetary stresses experienced by the colleges on a differential basis, is cause for concern. It is not clear whether or to what degree upper administration examines such expenditures, and in juxtaposition with the demonstrable need across the colleges.
In Part II of this series, we will examine in-depth the trends in spending by the colleges, academic units and administrative units in each of the categories of operating expenditures listed in Chart IV. Note that although the operating expenditures are divided into the GL-coded categories, these categories are not defined, nor is additional detail provided at this level as to exactly what the money was spent on. That requires further public records requests.
For now, we can preview that discussion with some initial comments:
- Non-employee compensation and awards: Expenditures more than quadrupled over the six-year time period we are reviewing. While several academic and administrative units saw increases in this category during the relevant time period, a significant portion of that increase can be accounted for by Intercollegiate Athletics, which spent over $500,000 in that category in FY2014, up from approximately $10,000 in FY2009.
- Plaques/Trophies/Awards: Spending in this category nearly tripled over the relevant time period. While a large proportion of the increase spending on Plaques/Trophies/Awards is attributable to the Donor Recruitment activities of Hoxworth Blood Center, Intercollegiate Athletics spent more than $60,000 on this category in FY2014, reflecting an upward trend over this time period.
- Meetings, Seminars & Events: As Chart IV indicates, spending in this category jumped sharply from FY2009 to FY2014. This increase in spending is primarily driven by a unit of the College of Medicine designated as “CONMED,” which is most likely the college’s Continuing Medical Education program. However, Intercollegiate Athletics again accounts for a significant proportion of the increased expenditures in this category, reaching over $672,000 in FY2014. Several college offices also expended significant amounts on “Meetings/Seminars/Events” in FY 2014.
- Refreshments & Meals: While spending in this category declined from FY2009 to FY2014, it is showing an upward trend from FY2011, when it declined to $1.9 million. Spending in this area has trended upward in several college and administrative offices during this time period, including most notably the College of Business college office ($79,818 in FY2014), and the President’s office ($54,199 in FY2014).
- Services: Although there are GL codes for various types of services, including Legal Services, Housekeeping Services, and the like, the general “Services” category is apparently a catch-all for those expenses that are not easily categorized. Although spending in this category has declined sharply over the time period under review, some units have spent considerable amounts on “Services,” including notably the UC Clermont college office ($594,740 in FY2014, amounting to over one-third of its operating budget for that year).
- Consultants: Both academic units and administrative units engage consultants. While spending on consultants overall has declined, expenditures in several administrative units increased in FY2014, including in Administration & Finance Administration ($411,175), the Board of Trustees ($70,537), Chief Investment Officer ($555,729), Enrollment Management Administration ($100,000), the President’s Office ($117,600), and VP Government Relations & University Communication ($226,701), as well as in Intercollegiate Athletics ($100,545, up from $14,656 in FY2013).
- Distance Learning Support: As distance learning programs have been instituted and expanded across the University, spending on Distance Learning Support has exploded, from $0 in FY2009 to $15.2 million in FY2014. It is unclear at this point exactly what functions or services Distance Learning Support comprises; that is a subject for further investigation. However, several colleges spend considerable sums in this area, including most notably the College of Nursing ($6,244,532 in FY2014, representing 94% of the operating budget for Academic Nursing).
To Be Continued …
In Part I of this series, we have aimed to put into context the forthcoming in-depth examination of UC’s operating expenditures. An expenditure (say, $50,000 on “Refreshments & Meals”) has little meaning in a vacuum, but seen within the bigger picture (a college where expenditures on the college office have outpaced those for the academic units, for example), it takes on a different significance, raising questions about how prudently the University’s resources are being expended, and to what extent the core academic mission suffers as a result. Seemingly lavish spending in some sectors, while others chisel away at their budgets under the strictures of Performance-Based Budgeting, similarly raises questions about the PBB system as a method of distributing the University’s resources. We will look at the data and consider these questions further in Part II.
[i] This is a corrected figure from the percentage previously reported in “Education on the Cheap: Devaluing Students and Faculty” (Works, Vol. 22, No. 3, 30Mar2015.
—Stephanie Spanja, J.D.
Director of Research, UC Chapter AAUP
With input from the UC Chapter AAUP Budget and Compensation Advisory Committee and approval of the UC Chapter AAUP Executive Council
Political Action Committee Update
At the September 10th Chapter Meeting, our membership unanimously voted to support the following two statements:
Student leadership and activism are essential components for a vibrant academic environment at the University of Cincinnati. The faculty and the university administration must provide an environment where student leadership can grow and develop. The University of Cincinnati AAUP Chapter is particularly concerned about the treatment of important student-centered programs like RECLAIM and RAPP. RECLAIM offers critical peer advocacy that is a vital component of sexual assault response services on campus. RAPP develops important skills related to racial justice and inclusive leadership. Both have track records of success on campus. The AAUP-UC affirms its support of both programs and asks that the University, with fairness and transparency, reinstate all necessary funding, staffing, and training for RECLAIM and RAPP immediately.
____________________________________________________
The University of Cincinnati AAUP Chapter upholds the ideals of equal justice and dignity for all. We join with those mourning the death of Samuel DuBose, and call on our members to support Black Lives Matter forums, peaceful demonstrations, community meetings, student activists such as #theirate8, and other groups seeking to end institutionalized racism. True progress cannot happen without the support of diverse voices. We commit to working with the university to increase diversity within the faculty and university as a whole as we seek positive change in our campus and in the larger community.
Since that time, the PAC has been working to build connections with student groups on campus, as they move forward with their activism. Any members who would like to know more about student activism on campus can check out the UC-AAUP Group page on Facebook or follow AAUPUC on Twitter, where many of these events are posted and discussed.
Also at the September Chapter meeting, the Political Action Committee (PAC) recommended that the membership contribute $5,000 to Representative Fred Strahorn, $5,000 to Representative Driehaus, and $1,000 to Representative Dan Ramos. The motion was unanimously approved by the membership. All three State Representatives were instrumental in the Chapter’s fight against HB #64 this past spring. HB #64 would have reclassified faculty as managers and prohibited faculty from bargaining collectively. This would have eliminated all the protections of the collective bargaining and the contract. https://www.insidehighered.com/news/2015/04/17/ohio-bill-would-effectively-bar-faculty-unions-public-colleges. Chapter President Greg Loving presented these contributions to Representatives Driehaus, Ramos, and Strahorn at the Annual Meeting of the Ohio State AAUP Conference on Friday, November 6th in Columbus.
The Chapter sponsored a graduate student to do research for the One Good Job Cincinnati campaign, a coalition of labor, environmental, and community groups. The goal of the campaign is legislation in the City of Cincinnati requiring companies that receive public subsidies to pay a living wage, guarantee safe working conditions, and provide job training to low income residents. The coalition is now advocating for the legislation with the mayor and other stakeholders.
Frank Davis, active member of the PAC, has been working as a liaison with the Cincinnati Workers Justice Center, located at the Peaslee Neighborhood Center. Their weekly meetings are on Tuesdays from 5:00-6:00, and any interested folks are welcome to attend. Their current projects include wage rights, due process for workers, workplace safety, and reliable ID cards for immigrant workers.
Finally, the PAC is working to organize our third All-Union UC Labor Solidarity Luncheon, which will be held at the African-American Cultural Resource Center on Thursday, December 10th, from 11:30 until the food runs out. We hope you will plan to join us there.
President’s Corner
I read a story a few weeks back in The Atlantic about the national problem of adjunct professors living in poverty (http://www.theatlantic.com/business/archive/2015/09/higher-education-college-adjunct-professor-salary/404461/). The article reported that 31% of adjuncts are living at or below the poverty line. A new documentary, Professors in Poverty (http://www.bravenewfilms.org/professorsinpoverty?utm_campaign=prof_in_pov_ine&utm_medium=email&utm_source=bravenew,) documents the situation in more detail.
The University of Cincinnati is the largest employer in Cincinnati, a city that has been numbered among the country’s poorest according to the 2010 census. So let’s look at how the numbers for Cincinnati stack up, and how working at the University of Cincinnati looks in comparison. According to the 2015 Ohio Poverty Report from the Ohio Development Services Agency, a state affiliate of the US Census Bureau, Cincinnati has a 30.4% poverty rate. The poverty line in Cincinnati is $24,250 for a family of four (that number is ridiculously low to adequately support a family of four, but it’s the official number, so we’ll stick with it.) Working a full time job, a worker needs to make twelve dollars an hour to beat that (so long as they work 40 hours per week every week of the year, or get paid for vacations and sick days).
At UC, there are indeed people working for less than that. The American Federation of State, County and Municipal Employees (AFSCME), in fact, just voted on a new contract with the university after negotiations that bogged down for several months over compensation. Within AFSCME, automotive service workers, custodial workers, Head Start technicians, and laborers all make less than twelve dollars an hour. In other words, there are full time workers contributing to the university’s mission in critical support roles living in poverty. Let us hope that the new contract will improve on the situation. Other workers at the university lacking union protection make even less.
Returning to the issue of adjunct pay, an Adjunct Assistant Professor at the McMicken College of Arts and Sciences would have to teach nine classes a year to beat the poverty line. But they can’t teach nine classes per year. An annual adjunct is limited to seven classes per year. Even an Adjunct Full Professor, teaching the limit of seven courses annually, can’t beat poverty line.
To put all this in perspective, the President of the University makes over twenty times the poverty line for a family of four. The salary of any random Vice President is over ten times the poverty line. Most upper administrator bonuses and raises alone are several times the poverty line. It’s four times the poverty line to rent a new Founder’s Suite at Nippert Stadium for a year. The money dedicated to Nippert renovations clock in at over 3500 times the poverty line, and would fund a 5% raise for the entire faculty for over a decade. Stay tuned for actual costs to renovate Fifth Third Arena.
This is all at a university that claims that it wants to “invest in people.” So we’re starting a new hashtag: #investinpeople. I doubt it will compete much with #thehottestcollegeinamerica. I’m sure it’s a good marketing tool, but in the end it doesn’t mean a whole lot, aside from getting a free t-shirt every now and then. The AAUP’s mission statement includes defending shared governance and academic freedom, achieving continued improvements in faculty salaries and benefits, and promoting institutional excellence. It doesn’t include being #thehottestaaupchapterinamerica, although I believe we could make that case.
I care that we offer the highest quality education we can, that we do substantive research, and that we pay the people who support those missions enough that they can at least beat the poverty line. The University boasts a rhetoric of excellence until it comes to the subject of compensating its employees. Then mediocrity seems a laudable enough goal. Unfortunately, for many of UC’s employees, mediocrity would be an improvement.
So who is worthy of investment? The university has shown that it can #investinpeople who make the most. We need to show that we can be a Just Community and #investinpeople who make the least. That beats being #thehottestcollegeinamerica any day.
