Where Is the Money Going? An In-Depth Look at University Expenditures (Part I of II)

11-15 Newsletter Header

Where Is the Money Going? An In-Depth Look at University Expenditures (Part I of II)

Click here to jump to the President’s Corner

Click here to jump to the PAC Report

In a series of articles over the past few years, the UC Chapter AAUP has examined the Administration’s spending in “big picture” terms. We have looked at several categories of spending that appear in the University’s financial schedules, focusing on Instruction, Academic Support, and Institutional Support, to identify trends in spending. This macroscopic view is important, and provides a quick and easily digestible snapshot of where the University’s resources are being directed. On occasion, we have also examined the Administration’s spending on a “micro” level, taking close looks at spending on intercollegiate athletics (e.g., “The Athletics Budget: The True Cost of Playing the NCAA Game,” Works, Vol. 20, No. 3, 27 Mar 2013) and at spending on Academic/Upper Administration salaries and fringe benefits across college offices and selected administrative units (“UC Budget Priorities: An Examination of Administrative Costs,” Works, Vol. 20, No. 3, 27 Mar 2013).


Athletics spending and Administrators’ compensation are only two pieces of the spending puzzle; the question “Where is the money going?” has multiple answers. One area that we have not yet devoted attention to is the University’s operating expenditures. “Operating Expenditures” is one category of spending listed in the University’s schedules to its financial audits, alongside “Salaries,” “Fringe Benefits,” “Capital Expenditures,” “Student Financial Aid,” and “Other Expenditures.”  The schedules indicate the total amounts of money that each administrative and academic unit has spent in each category, but do not provide more specific detail on exactly how the money is being spent.


Through a public records request, the UC Chapter AAUP obtained a detailed breakdown of operating expenditures for each administrative and academic unit for the fiscal years (“FY”) 2009 through 2014. Each category of expenditure is indicated by a “General Ledger” code (“GL code”). There are hundreds of GL codes, covering every conceivable type of expenditure related to the day-to-day functioning of an office, from “Travel” of various kinds to “Office Supplies,” from “Fuel-Oil” to “Telephones,” from “Postal Fees” to “Studio Rental,” and everything in-between. While tracing spending over time in every GL code across all the units is not practical and may be of limited utility, a look at selected GL codes that appear to be commonly used among numerous administrative and academic units is illuminating, and in some cases reveals significant disparities across colleges, academic departments, administrative units and, of course, intercollegiate athletics.


The following is the first in a two-part series in which we examine University spending from the macro to the micro level. In this part, we start with an examination of trends in spending across the categories of “Instruction,” “Academic Support” and “Institutional Support,” and then compare expenditures across colleges and administrative units. This provides the necessary context for our look at selected GL-coded “Operating Expenditures” across the University, a glimpse of which concludes this part of the two-part series.


University Spending—The Big Picture


In our two-part series “Education on the Cheap: Devaluing Students and Faculty” (Works, Vol. 22, No. 3, 30Mar2015 and Works, Vol. 22, No. 4, 27 May 2015), we took note of UC’s massive enrollment increase over the past half-decade. In Fall Quarter 2008, UC’s student FTEs (“full-time equivalents”) totaled 29,593. Beginning with Fall Quarter 2009, UC’s enrollment began to increase, at first sharply and then robustly, over the next several years, reaching 33,690 FTEs by Fall Semester 2013.

At the same time, the University’s unrestricted revenues grew from $841.6 million in FY2009 to $945.4 million in FY2014 (in inflation-adjusted dollars), a 12% increase driven in significant part by a 33.8% increase in revenues from tuition. However, spending on Instruction from unrestricted general funds actually declined by 7.7%.[i], while spending on Academic Support from unrestricted general funds increased by 25% and spending on Institutional Support grew by 24%. (Chart I)  Over this same time period, the Administration increased support for Athletics from $8.6 million to $20.3 million. (Chart IA)


Chart 1: Big-Picture Trends in Spending from General Funds

Chart 1: Big-Picture Trends in Spending from General Funds

Chart 1A: University Support for Athletics from General Funds

Chart 1A: University Support for Athletics from General Funds

In the big-picture sense, then, spending on Instruction—the University’s core academic mission—has dropped while administrative sectors have seen increases in funding, and Administration support for Athletics has more than doubled. That’s one of the answers to the question “Where is the money going?” but it is the most general answer, and at this point, it’s hardly news to most. Let’s dig a little deeper and look at what’s happening at the college level, and also take a look at spending across some administrative units. Because several administrative units were not identified in consistent terms in the University’s schedules covering FY09 through FY12 (particularly those related to budget management, student affairs and enrollment management), we are focusing on those which are clearly identifiable.

Trends in College and Library Spending

Chart II shows the inflation-adjusted expenditures in UC’s colleges and in UC’s Libraries (except for the College of Medicine, which is unique among the colleges for its heavily-grant driven revenue stream and expenditures). Please note that the categories of spending—“Total Expenditures,” “Salaries and Fringe Benefits,” and “Operating Expenditures”—reflect expenditures from both unrestricted funds (general funds) and other funding sources, including restricted funds and government contracts. The financial schedules do not indicate which source(s) are used to fund a given expenditure. Nonetheless, much of the information on Chart II largely reflects the trends we have identified in our previous articles, e.g., expenditures have largely failed to keep pace with increases in FTEs, and college offices often fare better than academic units.
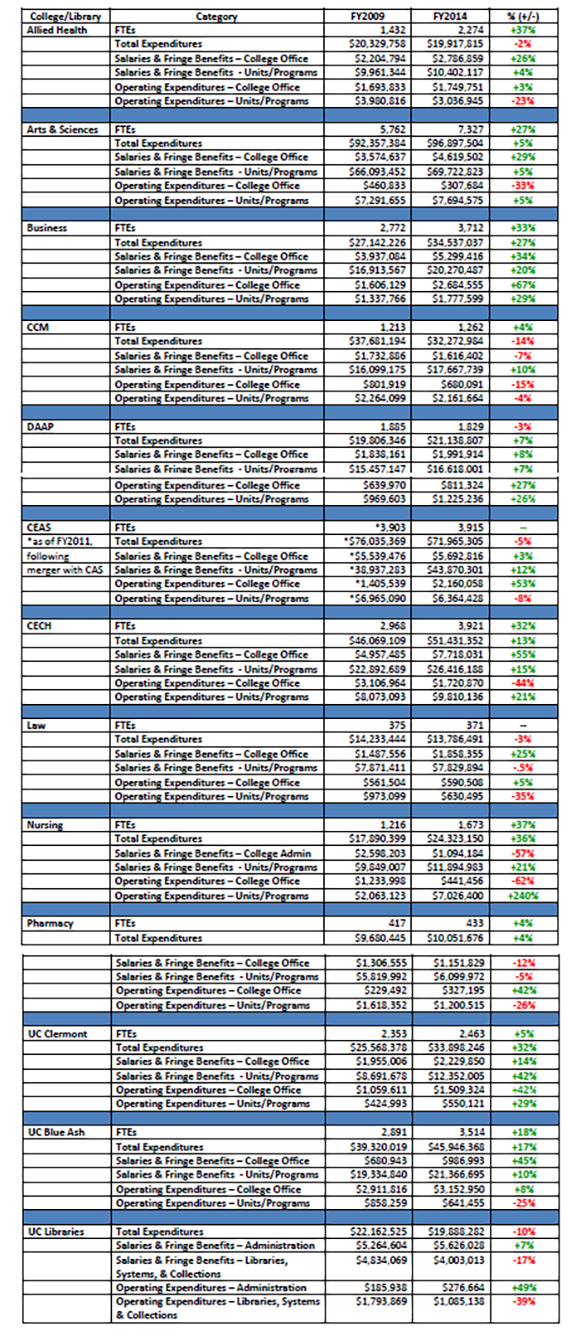
Chart II

Chart II

Here are some notable takeaways from Chart II:

  • Total expenditures kept pace with (or exceeded) the growth in FTEs in only four colleges: DAAP, Nursing, Pharmacy and UC Clermont.
  • Although FTEs grew at Allied Health and CCM, total expenditures actually decreased at those colleges.
  • Spending on Salaries & Fringe Benefits for College Offices or Administrations increased at a faster pace (and in the case of some, significantly so) than for academic units and programs at over half of colleges (and library) on the list: Allied Health, A&S, Business, CECH, Law, UC Blue Ash and UC Libraries.
  • There is considerable variation across the colleges and UC Libraries with respect to changes, up or down, in operating expenditures for college administrations and academic units, to the extent that is not possible to identify any particular trends.


The drastic drop in expenditures on the college office and administration in the College of Nursing appears anomalous on the surface. However, this may reflect a reallocation of administrative expenditures among other units within the college, such as the Institute for Nursing Research. Total expenditures for the Institute for Nursing Research ballooned from approximately $250,000 in FY 2013 to nearly $2.2 million in FY2014; approximately $1.35 million of that amount was directed to “academic support,” a category that typically includes Deans’ offices and other administrative functions.
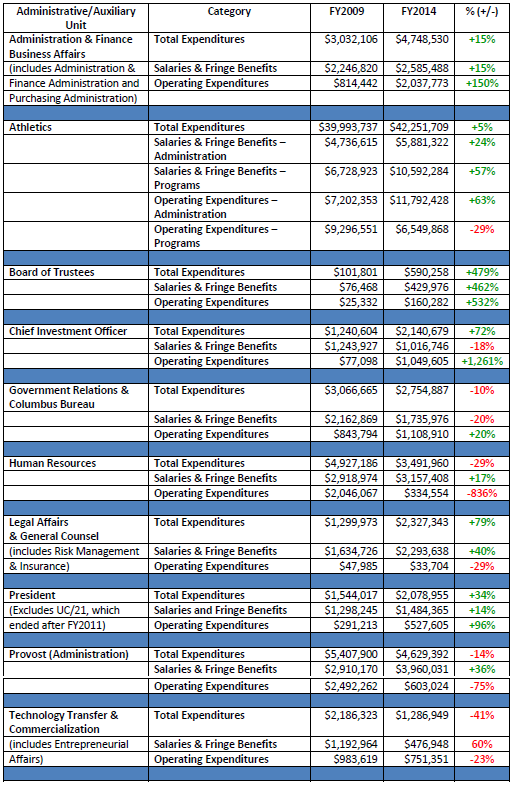
Chart III

Chart III

Trends in Spending on Some Administrative Units and in Athletics

Although Chart III does not show spending trends in all administrative units, but rather a cross-section which includes several major offices in upper administration, as well as those sectors which would appear to play an important role in advancing the University’s interests with government and in industry. One caveat: while there are multiple administrative units related to the University’s financial operations, they are not identified in a consistent manner across the financial schedules until FY2013. Therefore, Chart III reflects data for the most clearly and consistently identifiable financial office across the Administration. In a future article, we will update this chart with additional information in order to provide a more complete picture of expenditures as they relate to the University’s financial offices and functions, which comprise a significant part of the University’s expenditures as relates to Institutional Support.

Chart III indicates that, while spending on “Institutional Support” has indeed increased significantly over a relatively short period of time, it has not increased evenly across the board. The “administration” is not a monolith, but rather, as with the colleges, some sectors fare better than others. While expenditures for several administrative units have increased significantly, they have declined for others, such as Technology Transfer and Commercialization, as well as for the University’s Government Relations offices. The decline in funding for these two offices in particular is puzzling, given that one of the stated missions of the former (which houses the University’s Intellectual Property Office) is to  “leverage the considerable, existing research and educational assets in order to establish UC as the premier, comprehensive program for entrepreneurship in the region and nationally”, (http://www.ipo.uc.edu/index.cfm?fuseaction=home.mission, accessed Web 5 Nov 2015), while the Government Relations and Columbus Bureau presumably would be interacting with state legislators who hold the purse strings for higher education.

Finally, while the overall percentage growth in expenditures on Athletics is relatively modest, the Administration has more than doubled its support for Athletics over the same time period, so that “nonmandatory transfers” from general funds and other allocations comprise nearly half of Athletics’ $42.2 million expenditures for FY2014.

Operating Expenditures: Getting Down to the Nitty-Gritty

Progressing from the macroscopic to a more microscopic view, we now turn to the University’s operating expenditures. As we indicated above, there are General Ledger codes (“GL codes”) for literally hundreds of categories of operating expenditures. Chart IV is a list of GL coded-operating expenditures that we will begin to review in this article and go into further detail in the next. We have selected these particular codes because they arguably are indicative of the quality of life across the University’s various colleges, academic units and administrative (and auxiliary) enterprises. The numbers suggest that this quality of life can vary dramatically from college to college and unit to unit, and significantly impact faculty members’ professional lives. By highlighting these categories and the various amounts spent by colleges and units, we are not necessarily challenging the idea that colleges and units have discretion to spend their budgets. For example, we don’t question that a Dean’s office may need to host an event that requires refreshments, or that it might be appropriate for Athletics to bestow awards upon its athletes. However, the extent of such expenditures, placed in the overall context of the budgetary stresses experienced by the colleges on a differential basis, is cause for concern. It is not clear whether or to what degree upper administration examines such expenditures, and in juxtaposition with the demonstrable need across the colleges.

In Part II of this series, we will examine in-depth the trends in spending by the colleges, academic units and administrative units in each of the categories of operating expenditures listed in Chart IV. Note that although the operating expenditures are divided into the GL-coded categories, these categories are not defined, nor is additional detail provided at this level as to exactly what the money was spent on. That requires further public records requests.

For now, we can preview that discussion with some initial comments:

  • Non-employee compensation and awards: Expenditures more than quadrupled over the six-year time period we are reviewing. While several academic and administrative units saw increases in this category during the relevant time period, a significant portion of that increase can be accounted for by Intercollegiate Athletics, which spent over $500,000 in that category in FY2014, up from approximately $10,000 in FY2009.
  • Plaques/Trophies/Awards: Spending in this category nearly tripled over the relevant time period. While a large proportion of the increase spending on Plaques/Trophies/Awards is attributable to the Donor Recruitment activities of Hoxworth Blood Center, Intercollegiate Athletics spent more than $60,000 on this category in FY2014, reflecting an upward trend over this time period.
  • Meetings, Seminars & Events: As Chart IV indicates, spending in this category jumped sharply from FY2009 to FY2014. This increase in spending is primarily driven by a unit of the College of Medicine designated as “CONMED,” which is most likely the college’s Continuing Medical Education program. However, Intercollegiate Athletics again accounts for a significant proportion of the increased expenditures in this category, reaching over $672,000 in FY2014. Several college offices also expended significant amounts on “Meetings/Seminars/Events” in FY 2014.
  • Refreshments & Meals: While spending in this category declined from FY2009 to FY2014, it is showing an upward trend from FY2011, when it declined to $1.9 million. Spending in this area has trended upward in several college and administrative offices during this time period, including most notably the College of Business college office ($79,818 in FY2014), and the President’s office ($54,199 in FY2014).
  • Services: Although there are GL codes for various types of services, including Legal Services, Housekeeping Services, and the like, the general “Services” category is apparently a catch-all for those expenses that are not easily categorized. Although spending in this category has declined sharply over the time period under review, some units have spent considerable amounts on “Services,” including notably the UC Clermont college office ($594,740 in FY2014, amounting to over one-third of its operating budget for that year).
  • Consultants: Both academic units and administrative units engage consultants. While spending on consultants overall has declined, expenditures in several administrative units increased in FY2014, including in Administration & Finance Administration ($411,175),  the Board of Trustees ($70,537), Chief Investment Officer ($555,729), Enrollment Management Administration ($100,000), the President’s Office ($117,600), and VP Government Relations  & University Communication ($226,701), as well as in Intercollegiate Athletics ($100,545, up from $14,656 in FY2013).
  • Distance Learning Support: As distance learning programs have been instituted and expanded across the University, spending on Distance Learning Support has exploded, from $0 in FY2009 to $15.2 million in FY2014. It is unclear at this point exactly what functions or services Distance Learning Support comprises; that is a subject for further investigation. However, several colleges spend considerable sums in this area, including most notably the College of Nursing ($6,244,532 in FY2014, representing 94% of the operating budget for Academic Nursing).

To Be Continued …

In Part I of this series, we have aimed to put into context the forthcoming in-depth examination of UC’s operating expenditures. An expenditure (say, $50,000 on “Refreshments & Meals”) has little meaning in a vacuum, but seen within the bigger picture (a college where expenditures on the college office have outpaced those for the academic units, for example), it takes on a different significance, raising questions about how prudently the University’s resources are being expended, and to what extent the core academic mission suffers as a result. Seemingly lavish spending in some sectors, while others chisel away at their budgets under the strictures of Performance-Based Budgeting, similarly raises questions about the PBB system as a method of distributing the University’s resources. We will look at the data and consider these questions further in Part II.

[i] This is a corrected figure from the percentage previously reported in “Education on the Cheap: Devaluing Students and Faculty” (Works, Vol. 22, No. 3, 30Mar2015.

—Stephanie Spanja, J.D.
Director of Research, UC Chapter AAUP

With input from the UC Chapter AAUP Budget and Compensation Advisory Committee and approval of the UC Chapter AAUP Executive Council

Political Action Committee Update

Phoebe Reeves, PAC Committee Chair

Phoebe Reeves, PAC Committee Chair

At the September 10th Chapter Meeting, our membership unanimously voted to support the following two statements:

Student leadership and activism are essential components for a vibrant academic environment at the University of Cincinnati. The faculty and the university administration must provide an environment where student leadership can grow and develop.  The University of Cincinnati AAUP Chapter is particularly concerned about the treatment of important student-centered programs like RECLAIM and RAPP.  RECLAIM offers critical peer advocacy that is a vital component of sexual assault response services on campus. RAPP develops important skills related to racial justice and inclusive leadership. Both have track records of success on campus.  The AAUP-UC affirms its support of both programs and asks that the University, with fairness and transparency, reinstate all necessary funding, staffing, and training for RECLAIM and RAPP immediately.

____________________________________________________

The University of Cincinnati AAUP Chapter upholds the ideals of equal justice and dignity for all. We join with those mourning the death of Samuel DuBose, and call on our members to support Black Lives Matter forums, peaceful demonstrations, community meetings, student activists such as #theirate8, and other groups seeking to end institutionalized racism. True progress cannot happen without the support of diverse voices. We commit to working with the university to increase diversity within the faculty and university as a whole as we seek positive change in our campus and in the larger community.

Since that time, the PAC has been working to build connections with student groups on campus, as they move forward with their activism. Any members who would like to know more about student activism on campus can check out the UC-AAUP Group page on Facebook or follow AAUPUC on Twitter, where many of these events are posted and discussed.

Also at the September Chapter meeting, the Political Action Committee (PAC) recommended that the membership contribute $5,000 to Representative Fred Strahorn, $5,000 to Representative Driehaus, and $1,000 to Representative Dan Ramos. The motion was unanimously approved by the membership. All three State Representatives were instrumental in the Chapter’s fight against HB #64 this past spring. HB #64 would have reclassified faculty as managers and prohibited faculty from bargaining collectively.  This would have eliminated all the protections of the collective bargaining and the contract. https://www.insidehighered.com/news/2015/04/17/ohio-bill-would-effectively-bar-faculty-unions-public-colleges. Chapter President Greg Loving presented these contributions to Representatives Driehaus, Ramos, and Strahorn at the Annual Meeting of the Ohio State AAUP Conference on Friday, November 6th in Columbus.

The Chapter sponsored a graduate student to do research for the One Good Job Cincinnati campaign, a coalition of labor, environmental, and community groups. The goal of the campaign is legislation in the City of Cincinnati requiring companies that receive public subsidies to pay a living wage, guarantee safe working conditions, and provide job training to low income residents. The coalition is now advocating for the legislation with the mayor and other stakeholders.

Frank Davis, active member of the PAC, has been working as a liaison with the Cincinnati Workers Justice Center, located at the Peaslee Neighborhood Center. Their weekly meetings are on Tuesdays from 5:00-6:00, and any interested folks are welcome to attend. Their current projects include wage rights, due process for workers, workplace safety, and reliable ID cards for immigrant workers.

Finally, the PAC is working to organize our third All-Union UC Labor Solidarity Luncheon, which will be held at the African-American Cultural Resource Center on Thursday, December 10th, from 11:30 until the food runs out. We hope you will plan to join us there.

President’s Corner

Greg Loving, President UC-AAUP

Greg Loving, President UC-AAUP

I read a story a few weeks back in The Atlantic about the national problem of adjunct professors living in poverty (http://www.theatlantic.com/business/archive/2015/09/higher-education-college-adjunct-professor-salary/404461/). The article reported that 31% of adjuncts are living at or below the poverty line. A new documentary, Professors in Poverty (http://www.bravenewfilms.org/professorsinpoverty?utm_campaign=prof_in_pov_ine&utm_medium=email&utm_source=bravenew,) documents the situation in more detail.

The University of Cincinnati is the largest employer in Cincinnati, a city that has been numbered among the country’s poorest according to the 2010 census. So let’s look at how the numbers for Cincinnati stack up, and how working at the University of Cincinnati looks in comparison. According to the 2015 Ohio Poverty Report from the Ohio Development Services Agency, a state affiliate of the US Census Bureau, Cincinnati has a 30.4% poverty rate. The poverty line in Cincinnati is $24,250 for a family of four (that number is ridiculously low to adequately support a family of four, but it’s the official number, so we’ll stick with it.) Working a full time job, a worker needs to make twelve dollars an hour to beat that (so long as they work 40 hours per week every week of the year, or get paid for vacations and sick days).

At UC, there are indeed people working for less than that. The American Federation of State, County and Municipal Employees (AFSCME), in fact, just voted on a new contract with the university after negotiations that bogged down for several months over compensation. Within AFSCME, automotive service workers, custodial workers, Head Start technicians, and laborers all make less than twelve dollars an hour. In other words, there are full time workers contributing to the university’s mission in critical support roles living in poverty. Let us hope that the new contract will improve on the situation. Other workers at the university lacking union protection make even less.

Returning to the issue of adjunct pay, an Adjunct Assistant Professor at the McMicken College of Arts and Sciences would have to teach nine classes a year to beat the poverty line. But they can’t teach nine classes per year. An annual adjunct is limited to seven classes per year. Even an Adjunct Full Professor, teaching the limit of seven courses annually, can’t beat poverty line.

To put all this in perspective, the President of the University makes over twenty times the poverty line for a family of four. The salary of any random Vice President is over ten times the poverty line. Most upper administrator bonuses and raises alone are several times the poverty line. It’s four times the poverty line to rent a new Founder’s Suite at Nippert Stadium for a year. The money dedicated to Nippert renovations clock in at over 3500 times the poverty line, and would fund a 5% raise for the entire faculty for over a decade. Stay tuned for actual costs to renovate Fifth Third Arena.

This is all at a university that claims that it wants to “invest in people.” So we’re starting a new hashtag: #investinpeople. I doubt it will compete much with #thehottestcollegeinamerica. I’m sure it’s a good marketing tool, but in the end it doesn’t mean a whole lot, aside from getting a free t-shirt every now and then. The AAUP’s mission statement includes defending shared governance and academic freedom, achieving continued improvements in faculty salaries and benefits, and promoting institutional excellence. It doesn’t include being #thehottestaaupchapterinamerica, although I believe we could make that case.

I care that we offer the highest quality education we can, that we do substantive research, and that we pay the people who support those missions enough that they can at least beat the poverty line. The University boasts a rhetoric of excellence until it comes to the subject of compensating its employees. Then mediocrity seems a laudable enough goal. Unfortunately, for many of UC’s employees, mediocrity would be an improvement.

So who is worthy of investment? The university has shown that it can #investinpeople who make the most. We need to show that we can be a Just Community and #investinpeople who make the least. That beats being #thehottestcollegeinamerica any day.


PBB: The High Cost of “Efficiency”

Click here to jump to the President’s Corner

Higher fees, larger class sizes, fewer faculty

Since Fiscal Year 2010 (“FY10”), which runs from July 1, 2009–June 30, 2010, the UC Administration has utilized Performance Based Budgeting (“PBB”). According to the PBB model, each college or administrative unit must meet a pre-determined budget deficit—referred to as a “threshold”—“through growth, cost-saving measures, or some combination of these two factors.” UC FY15-16 Current Funds Budget Plan (p. 14). Chief among PBB’s virtues, according to the Administration at the time the Board of Trustees approved the use of PBB, is that it “ensures transparency and accountability.” (“Performance Based Budgeting, 5 Years Later: The Real World Effects of Transparency,” Works, Vol. 21, No. 7, 7Nov2014, at 5).

As we have previously observed, PBB is “certainly transparent in the sense that PBB reports are readily available through the Office of Institutional Research under the Provost, and in that there is a clear formula by which indirect expenditures are calculated and assigned to each college.” Id. at 4. However, as we have also noted, the PBB model masks the value judgements inherent in the decision makers’ determinations as to the cost of running the University’s various units; it is blind to its detrimental impacts upon students and faculty; and, implicitly or otherwise, it rewards and encourages those consequences.

PBB_Box1

The PBB Process

The Administration is aware of the pressures imposed on the colleges by PBB, and at least some of its negative impacts, because in the months before a new fiscal year begins, each college must submit a plan for how it will meet its “threshold,” and these plans detail exactly where the “cost savings” and “efficiencies” will come from. Several months ago, the UC Chapter AAUP obtained via a public records request copies of these plans from FY11 (when they first appear to have been utilized) through FY15. Undeniably, the PBB model appears to have inspired some measure of creativity and innovation among the colleges in the development of new degree programs, as well as prompting hard looks at potentially wasteful or duplicative administrative and academic expenditures. However, these plans also make clear that PBB has exacted significant “costs” on faculty and students:

  1. The PBB model is spectacularly unsuited for colleges which, either due to space limitations and/or their unique pedagogical needs, cannot easily “grow” their way out of a threshold. This includes colleges such as DAAP, CCM, Pharmacy and Law.
  2. Increased class sizes, unfilled faculty vacancies and increased TA workloads are frequently touted as “cost savings” and “efficiencies.”
  3. Revenue “growth” has been realized through tuition and/or fee increases at the Colleges of Law, Pharmacy, Business, CCM and CEAS.
  4. The PBB process implicitly encourages the quantification of intangibles, to sometimes absurd results.
  5. Quality of life for faculty – as well as the student experience – can vary significantly from college to college. There are “haves” and “have nots” within the same UC community.

Although the plans suggest that some colleges have received some measure of relief from the Provost’s office when significant cuts gravely threatened their core mission, the fact that these colleges have had to plead their cases—sometimes repeatedly—to the Administration raises the question as to whether having colleges engage in this sort of annual advocacy to preserve their core missions is the most “efficient” use of University resources. Moreover, although the Administration has proposed less drastic thresholds in recent years, there is always the possibility of future budget crunches, and these plans illustrate how some colleges—as well as, in some cases, the University’s reputation—could suffer as a result.

The following is a look at PBB’s impacts on the colleges through the lens of their threshold plans. Although Administration and Finance also submits a master threshold plan for its units, we are restricting our focus to those units—the colleges—which interact most directly with students and are most directly aligned with the University’s core academic mission. The one exception to this is UC Libraries; while not a revenue generator, it is integral to UC’s academic mission and a participant in the PBB process, in which it has not fared well.

We acknowledge that faculty and administrators in all colleges have expended tremendous efforts within the PBB framework toward improving their programs, creating new degrees and certificates, and other innovations. The following discussion is not intended to diminish these efforts, but to bring to light the “collateral damage” that PBB has exacted on faculty and students.

PBB_Box2

Doing the PBB Math

Growth Through Tuition and Fee Hikes—Pharmacy, Law, CCM and CEAS

Law

Facing a projected threshold share of $1.2 million for FY12, UC’s College of Law (“Law”) informed the Administration in its FY12 Plan that its “mission and key goals, as well as the rankings environment, necessitate that our enrollment target remain at 400.” Law thus proposed to meet its threshold share through only a small increase in enrollment, a 6% tuition increase, and through the use of vacant position dollars, noting that the latter would have a “potential adverse impact on [U.S. News and World Report] rankings.” The Board of Trustees subsequently approved the 6% tuition increase for the College of Law at its June 21, 2011 meeting.

The following year, in its FY13 Plan, Law implored the Administration for relief from its previous budget shortfalls and prospective budget cut for FY13, and asked for additional resources for the Library Collections budget, noting that the Law Library’s “budget has been flat for several years while vendors’ prices continue to rise.” In a memorandum dated February 24, 2012, then-Dean Louis Bilionis informed then-Provost Santa Ono that the “College’s administration and faculty have great reservations” about a scenario that would involve meeting a 7% budget cut by increasing tuition by 6% and growing enrollment from 409 to 419:

Our current students already are shaken by the depressed legal job market and rising debt loads. A further increase in tuition, to support internal redistribution objectives of the University, asks much from them if no other adverse consequences were involved. But the College’s median LSAT will drop from 160 to 158, and there would be every reason to forecast a rankings downturn. No discipline is more rankings-sensitive than law, and a drop in rankings will be received in many quarters as a decline in quality and a depreciation in the value of the degree conferred. (emphasis added) Id.

Despite Law’s concerns, the Board of Trustees approved another 6% tuition increase at its June 26, 2012. Moreover, expenditures on the Law Library actually dropped by over $60,000 from FY12 to FY13. Supplemental Schedules to the Annual Financial Report, FY2012; Annual Fund Accounting Schedules, FY2013.

While the threshold plans and presentations for FY14 and FY15 do not contain the urgent appeals made in previous years, the FY15 Plan details numerous “cost savings” and “efficiencies” which demonstrate the extremes, painful and at times even absurd, to which Law has resorted in order to meet its threshold share, including, among others:

  • Eliminated a receptionist, faculty support secretary, and a Library Circulation Manager “ for a combined savings of approximately $118,000
  • “Eliminated senior banquet for graduating students”—“cost savings” of $10,000
  • “Eliminated several orientation lunches for new students—“cost savings” of $6,000

CCM

The imposition of PBB early on prompted repeated pleas for relief from CCM to the Administration. For example, in a December 7, 2010 memorandum to then-Provost Santa Ono and the Provostal staff, then-Interim Dean Frank Weinstock responded to a request to submit a plan for a possible 20% general funds budget cut, and indicated that growth in enrollment was not feasible because CCM is “constrained by space, as we are already at a significantly higher enrollment than our facility was built for just twelve years ago.” Further, Weinstock explained that leaving open faculty positions vacant was not an option “because of the amount of one-on-one instruction as well as the specialization of such instruction (a clarinet faculty member cannot teach a flute major, for example).” Concluding, Weinstock stated: “I hope it is clear that to make the cuts in this plan would be a suicidal move on CCM’s Part.”

The following year, in its FY13 Plan, CCM again explained that it could not “expand enrollments as simply as other colleges and cannot easily contract due to the interdependence of one sub-specialty on the other.” CCM’s FY13 Plan also stands out for the concerns it expressed for how current faculty have been impacted by lagging hiring, noting that “faculty in varying pockets of CCM are working well beyond the loads stated in CCM’s workload document,” with some faculty “absorb[ing] additional teaching responsibilities above the realm of sustainability.”

In succeeding years, CCM faced smaller potential threshold shares, which in FY14 still necessitated a proposal to generate new revenue through a new $500 per year fee for new undergraduate and graduate students. Encouragingly, in its FY15 Plan, CCM indicated that it had not only replaced 7 faculty positions which had become vacant through retirements and non-renewals, but it had also hired 2 new faculty positions. Although the documentation is not clear as to the extent of relief that CCM may have received from its particular threshold share burden, the new hiring is a positive sign. However, the fact that this turnaround appeared to have involved years of repeated advocacy, stating and restating the obvious, is troubling.

Pharmacy

In its FY12 Plan, Pharmacy provided some interesting historical commentary on the University’s finances, noting that “Because many buildings were constructed on campus over the last 20 years, the campus was transformed into a very attractive and student-friendly environment. However, this transformation had an adverse effect on the overall financial stability of the university.” Continuing, Pharmacy’s FY12 Plan observed:

[O]ur class size does not allow for any further increases in enrollment because of the limitations of its classrooms and teaching laboratories. In effect, our enrollment is capped and our revenue generation is severely impaired. … If no help is provided by the Provost, the college will exhaust all of its reserves by 2014 and by that date personnel lines will have to be cut.

CEAS

In its FY13 Plan, CEAS proposed to meet a significant $1.67 million threshold share partially with an increase in graduate enrollment (with revenue growth of approximately $600,000), and from not replacing vacant positions, including 5 faculty positions which, CEAS noted, would “impact programs and reduce research base, and affect rankings.” The FY13 Plan also listed several “efficiencies” CEAS had achieved in FY11, including “increase[ing] the special fee for all CEAS students to 10% of undergraduate tuition (Fall 2011)” and experiencing a decrease in the number of tenure track faculty.

In its FY14 Plan, CEAS included a FY13 PBB Progress Tracking Report, which indicated that it was “giving up $1.5 million in permanent general funds to meet our threshold.” The FY14 Plan also included a faculty hiring plan, listing 8 faculty who separated or retired, and only 4 approved searches in progress, though CEAS asked the Provost to approve the 7 additional new positions in its hiring plan.

Some progress appeared to have been made in the following year with respect to increasing faculty hiring. At an April 3, 2014 Budget Hearing, CEAS noted that “Faculty Hiring is Key to Third Century Plan” and announced that it had “initiated faculty hiring—launching 50 in 5” (50 hires in 5 years). With a looming threshold share of approximately $850,000, CEAS expressed its expectation to meet or exceed it through massive growth in graduate and undergraduate enrollment and distance learning. Even so, small economies continued; the FY15 Plan reported that, in FY13, the “Office of Undergraduate Academic Affairs stopped giving gifts for graduating students.”

UC Libraries

Beginning with its first threshold plan for FY11 through its FY15 plan, UC Libraries has consistently alerted the Administration to the impacts of the long-term decline in its investment in the library system. In its FY11 Plan, UC Libraries noted that its library staff had been “already reduced by 35% from Fy02 to FY10. Again in its FY13 Plan, UC Libraries reminded the Administration of its sharp decline in staff, and stated that a threshold share cut could not be sustained through staff reductions “if we are to continue to be a research library system.” UC Libraries further indicated that while the collections budget had remained flat from FY10 to FY12, inflationary pressures continued.

Finally, UC Libraries has continuously alerted the University of its sharply declining ranking in the annual report produced by the Association of Research Libraries (“ARL”), a “nonprofit organization of 124 research libraries at comprehensive, research institutions in the US and Canada” as one important benchmark of its investment in its library system. The ARL provides an annual ranking of participant libraries in multiple categories, including total library investment. In its FY11 Plan, UC Libraries indicated that UC’s ARL ranking had plummeted from #45 in FY2003 to #72 in FY08 (out of 113 research institutions). In its FY15 Plan, UC Libraries once again alerted the Administration to its #72 ARL ranking, a 20-point decline since FY03. Despite these warnings, UC Libraries’ expenditures actually declined from $20.6 million in FY10 to $19.8 million in FY14.

CECH –Deliberate Disinvestment in Faculty

From the inception of PBB, the College of Education, Criminal Justice and Human Services ‘ (“CECH”) threshold share plans stand out as consummate exercises in public relations: highly polished, with a significant use of “buzzwords” and always sunny in outlook. The message is always the same: no matter what financial challenges CECH may face, “faculty and staff are up to the task.” CECH FY12 Plan. Beginning with its FY12 Plan and continuing through to FY15, CECH has repeatedly reported to the Administration that its student enrollment growth far outpaced its faculty hiring. For example, in its FY12 Plan, CECH noted:

A decade ago the student to full-time faculty ratio was 21 to 1 and now this ratio is 39 to 1. […] Without question, the faculty and staff in this college are doing more with less and doing it exceptionally well.

Far from accidental, the lagging faculty hiring in CECH was at least to some extent deliberate. In its Budget Narrative for FY12, CECH stated: “Over the last several years, faculty have retired or resigned but their open lines were not filled. Instead, their available salaries were set aside to protect the college against budget cuts or for strategic reinvestment.” CECH listed 20 faculty vacancies and a “savings” of $1.37 million. In its Strategic Plan for FY12, CECH characterized this money as having been “escrowed as a direct result of disinvestment.” Although CECH noted that there was currently 1 active faculty search, and that it requested permission for 10 more faculty searches, these searches (if successful) would have filled only little over half of the faculty vacancies.

Clearly, the CECH FY12 Plan did not cause significant alarm or prompt the Administration to direct that CECH change course, because in its FY13Plan, CECH again trumpeted the disproportionate growth in student enrollment in relation to faculty hiring:

One of the most important indicators of our cost reduction efforts is the comparison of our student growth to our faculty growth. Student enrollment has grown from 4,008 in 2006 to 5,446 in Fall 2011, an increase of 53%. Faculty has only grown 6.6%. Students have outgrown faculty by 798%, resulting in a 30% increase in our student-to-faculty ratio.

According to its FY13 Plan, CECH “survived this growth and sustained quality” because it implemented three strategies: “realigned staff positions,” “collaborative efforts” between the Recruitment Office and Student Services, and “leveraging online expertise” to “create efficiencies for recruiting and advising.” None of these vaguely-worded strategies addresses the impact of the enrollment and faculty disparity on class sizes or faculty workloads. CECH did note that it would continue its “tradition of events that bring together CECH faculty, staff and students, such as the Freshman Welcome Spaghetti Lunch, the Welcome Back BBQ, the Winter Chili Lunch, and the Spring Luncheon with Blue Ash and Clermont students,” at a cost of $15,000.

In its FY14 Plan, CECH listed numerous “cost savings” and “efficiencies” it had realized in 2012, including increased class sizes and expanded distance learning in the Schools of Human Services and Education, not filling open lines in the Schools of Human Services and Information Technology, and increasing the number of seats per section in the School of Information Technology.

Distance learning appears to have played a significant role in CECH’s PBB success story, projected to generate over $20 million in tuition revenue for CECH by F15, according to its FY15 Plan. In its F14 Plan, CECH cheerfully discussed its continued disparity in student enrollment growth and faculty hiring, in language virtually identical to that in its FY13 Plan:

One of the most important indicators of our cost reduction efforts is the comparison of our student growth to our faculty growth. Over the past five years, our enrollment has grown from 4,354 to 5,574 in Fall Semester of 2013, an increase of over 28%. Our faculty has only grown by 15%.

Using language sometimes identical to that in its FY13 Plan, CECH notes that it has “survived this growth and sustained quality” because it implemented the following strategies: “continuous reorganization,” “collaborative efforts,” “resource reallocation” and “process evaluation.” The narratives for these strategies do not address the fundamentals: impacts on class sizes, student advising, and faculty workload (both in the classroom and in service obligations).

Business

The Plans for Business contain a remarkable shift in tone from FY12 to FY15. In its FY12 Plan, Business expressed deep concern for the well-being of its faculty in the face of a significant increase in enrollment:

There are selected departments that are in critical need of additional faculty. … We intend to hire four in accounting—one chaired professor and three assistant professors[.] We will be hiring one faculty member in information systems and three in economics. Finally, all other departments need junior faculty. We currently have just four or five junior faculty in the college. The current faculty is also very taxed. The core business faculty (excluding recent additions of hospitality management and economics) is 30% smaller than it was just five years ago with increased enrollments.

In its FY13 Plan, Business continued to discuss hiring needs, department-by-department, and included statistics showing that, from 2006 to 2011, student FTEs had grown by 29.1%, while full-time faculty numbers had dropped by 13.8%, and class sizes had grown from an average of 26.5 to 40.8.

By the time of its FY15 Plan, Business discussed its huge enrollment growth in strictly bean-counter terms:

LCB’s cost (General & Local combined before scholarships) per instructional credit hour has improved from a FY’11 base of $329.47 to FY’12 $308.74, FY’13 $292.39 and projected FY ’14 $288.80—a $40.67 reduction (12.3%). By capitalizing on this ‘economy of scale’ opportunity LCB’s FY ’14 cost has been reduced by more than $4 million ($40.67 x 107,389 credit hours instructed). Cumulatively, this amounts to (about symbol) $10,000,000 of savings over the 3 years (FY’12 –FY’14).

For FY15, Business anticipated a surplus of over $6 million. Increased fees appear to be a significant factor in realizing that surplus: for FY10, student fees were assessed at 3% of tuition and resulted in nearly $700,000 in revenue. By FY14, student fees amounted to 8% of tuition and resulted in nearly $3 million in revenue. Some small progress did appear to be made with respect to faculty hiring: Business reported a 2.4% growth in faculty from FY06 to FY13—while student FTEs grew by 47.3% over that same time period, and part-time faculty grew by 229.4%.

We understand that recently Business has hired numerous additional faculty. We hope that, once new data is available, it will show that the student-faculty ratio has dropped.

A&S – Cutting Closer to the Bone

A&S’s threshold share plans paint a picture of a college in which financial pressures are prompting changes detrimental to students and faculty alike, as well as other cutbacks that, though small, are alarmingly telling about the state of affairs at A&S.

In multiple years, A&S’s threshold share plans cite increased class sizes in its lists of cost savings and efficiencies. In its FY11Plan, A&S informed the administration that class sizes would be increased and/or enrollment caps raised in the following departments: Communications, English, Political Science, Psychology and Women’s Studies. In its FY13Plan, A&S stated “We have increased class size virtually across the board.” Again, in its FY14 Plan, A&S noted that it had “increased class size” in Chemistry, Communications, Judaic Studies, Physics and Psychology. It is difficult to conceive how increased class sizes can be beneficial to students.

A&S’s Plans also indicate multiple negative impacts on its graduate students, including higher teaching loads and potentially greater debt burdens. In its FY12 Plan, A&S proposed to meet its threshold primarily through increased enrollment, but also by reducing collegiate funding for graduate assistants by $300,000. In its FY14 Plan, A&S noted that it had “increased non-assistantship Graduate Students” in Physics. In its FY15 Plan, A&S indicated that its Biology Department “doubled TA workload in Sophomore Bio and cut in half number of TA’s needed (14 to 7),” with a “savings” of $70,000. A&S also reported that its Mathematics Department had recruited approximately 18-20 “MS/PhD students with 100% out-State tuition paid,” worth $500,000 in revenue.

With respect to faculty hiring, A&S affirmed its “commitment to replace retired and non-reappointed [tenure-track] faculty.” FY11 Plan. As of its FY13 Plan, that commitment had not been fulfilled, as A&S noted that it had 18 faculty vacancies but only 6 hires. As we reported previously, as of the 2014-2015 academic year, there were 433 bargaining unit faculty in A&S, a 4.4% decline from the 2010-2011 academic year. (“Education on the Cheap: Devaluing Students and Faculty,” Works, Vol. 22, No. 3, 30 Mar. 2015).

Finally, as detailed in its FY15 Plan, A&S has been implementing small economies that give the impression it is being run on a shoestring:

  • History Department: “No longer give faculty $975 in Xeroxing credit. Encouraged faculty to use Blackboard to post syllabus and class notes instead of Xeroxing.”
  • Communications Department: “Discontinued stipend for the Forensic Debate Team,” for a savings of $1,500.

Nursing

In contrast with CECH’s Plans, the College of Nursing (“CON”) at least acknowledged the impacts of its declining faculty numbers on its current faculty, as in this example from its FY13 Plan:

We have maintained program integrity and all course offerings with a loss of faculty positions. In FY11 and FY12, 9 faculty that were teaching or eligible to teach in the PhD program retired or left for other employment. These positions remained unfilled and the program faculty covered for the shortage by teaching additional classes, taking on advisement of additional students and serving as dissertation chairpersons for more students.

In its FY14 Plan, the CON noted that it was “aggressively searching for qualified faculty but can realize cost savings [of $111,617] through delayed hires.” For FY15, the CON anticipated that “unfilled, yet budgeted and approved” faculty vacancies similarly would provide “significant savings” in for FY15. Meanwhile, in its FY15 Plan, the CON noted that it would be able to meet its threshold share through increased revenue from a projected enrollment growth of 75 students in its undergraduate and graduate programs combined.

One of the more curious features of the CON’s recent Plans has been its efforts to quantify certain “cost saving” activities. For example, in its FY14 Plan, the CON noted:

During 12FS, we implemented a new governance structure that more clearly defines the role of many of the College’s Committees and Councils, and gained efficiency by reducing the number of standing committees from 9 to 6.

According to the CON, this effort resulted in a “cost savings” of $25,000. Similarly, in its FY15 Plan, the CON stated that its Institute for Nursing Research and Scholarship had realized a “cost savings” of $12,000 after it:

streamlined and documented the entire grant process from examining the initial call to final grant close out. This provided clear direction and responsibilities of each party and eliminated additional work.

Allied Health

In its FY11 Plan, the College of Allied Health Sciences (“CAHS”) highlighted the fact that while it experienced significant enrollment growth over the previous six years, “the number of faculty and staff remained relatively unchanged during this growth period.” Advocating against the imposition of a potential 15% budget cut, CAHS stated: “While faculty, staff and administration have become accustomed to ‘doing more with less,’ we would now be forced to do less with less.”

CAHS continued to raise alarms about the disparity in its enrollment growth and faculty hiring in the PBB process for FY13. In a memorandum from then-Dean Elizabeth King to then-Provost Santa Ono, dated December 1, 2011 with the subject line “Rationale for Suggesting a More modest Budget Target for 2012-13,” Dean King noted that:

There has been an increase of 7 full-time faculty in 9 years. During these 9 years, student FTE grew from 453 in 2002 to 2,245, an increase of 441%. However, during this time, pat-time faculty grew from 7 to 36 or from 18% to over 40% [of total faculty]. […] While part-time faculty provide the teaching support for the enrollment growth, they have not contributed to providing additional support for students and/or college service needs.

Summarizing, Dean King stated: “the impact of the budget cuts over the past several years have resulted in a significant increase in the use of part-time faculty, an increase in class size, especially at the graduate level, increase in faculty-student ratio and a decrease in the amount of resources available to spend per student.”

In its FY14 Plan, however, CAHS indicated that it would meet its projected threshold share partly through 35 additional enrollees in its distance learning programs, though CAHS continued to advise the Administration that its Instructional FTE/Faculty ratio was growing and that its average graduate class size had increased by 50% since 2008.

The failure of PBB as a means of ensuring long-term re-investment in faculty at CAHS is underscored in its FY15 Plan, in which CAHS continues to inform the Administration that its full-time faculty (tenured or tenure track and qualified title) remained relatively static (52 in 2009, 56 in 2013). Although CAHS was positioned to meet its threshold share through an increase in distance learning enrollment (again), the FY15 Plan leaves no indication that a long-term hiring plan will be put in place to increase faculty hiring. To the contrary, its list of “Cost Savings and Efficiencies” for FY13 (included in its FY15 Plan) lists an Associate Professor position in the Communications Sciences and Disorders Department as “unfilled” for a savings of $106,000 (including benefits).

DAAP

DAAP’s Budget Reduction Plan for FY12, dated December 10, 2010, included a review of the previous decade, in which its 31% enrollment increase from 2000 to 2010 “did not result in additional funding for our college, “ but it did “however add significant revenue to the university.” Further, “[a]t the end of FY08 DAAP had to back-pay over $1.3M of permanent general funds to retroactively fulfill several years of missed budget cut obligations by the previous college administration.” Continuing, DAAP painted a bleak picture of its present situation:

Currently DAAP does not have sufficient qualified faculty and staff in the schools, the Business Office, the technical service areas, and Student Affairs. The School of Design, with four programs and over 1000 students, operates with one secretary. […] Further cuts will have a devastating impact on our already ‘stressed’ operation and begin to dismantle the integrity of our ‘DAAP brand.’

By the time it had submitted its FY14 Plan, DAAP was facing unique enrollment challenges related to the implementation of a semester co-op cycle, the difficulty of “plac[ing] co-op in large design classes,” “less demand in Art and Planning,” and “space and safety issues.” DAAP accompanied its FY14 Plan with a presentation with slides showing 120 students crowded into one Architecture and Interior Design Studio, as well as overflowing trash bins with the caption “scrap pours into the halls.” Although neither the FY14 nor the FY15 Plans address the issue of DAAP’s faculty and staff complement and its physical plant, the budget plans do not appear to indicate that there would be a significant increase in resources directed toward improving these issues. The University’s financial schedules confirm a lack of reinvestment in DAAP’s faculty: while expenditures for FY14 show a $650,000 increase in expenditures on salaries over FY10, over $570,000 of that amount was directed to the DAAP college office.

The Branch Campuses – UC Clermont and UC Blue Ash

UC Clermont has been challenged by declining enrollment, with its student FTEs dropping from 2701.2 in FY10 to 2,267.4 in FY14. In its FY15 Plan, UC Clermont noted that its enrollment decline tracked the decline in the Clermont County unemployment rate. UC Clermont’s Plans to that point had not indicated disparities in student enrollment and faculty hiring, so it has realized “cost savings” by not replacing some retiring faculty members. With a $640,000 threshold looming and an anticipated $1 million drop in tuition revenue for FY15, UC Clermont proposed a fee increase that would generate $240,000 in revenue, as well as moving nearly $950,000 from its reserves into its operating budget.

For FY11 and FY12, UC Blue Ash anticipated significant enrollment growth. For FY14, UC Blue Ash noted the departure of 12 faculty members and 17 staff members, to be replaced by 23 faculty members and 26 staff members. While UC Blue Ash’s faculty hiring has not kept pace with student enrollments (see “Education on the Cheap: Devaluing Students and Faculty (Part 2),” Works, Vol. 22, No. 4, 27 May 2015), its efforts in this respect stand in stark contrast to CECH and Business, for example, whose Plans appear to regard student enrollment and faculty hiring disparities as sources of pride in the context of PBB.

The College of Medicine

The College of Medicine (“Medicine”) occupies a unique place among the colleges, given that its revenues are primarily driven by research funding as opposed to tuition. Even so, Medicine is a participant in the PBB process, answerable for threshold shares from its revenues generated by tuition and SSI. In its Plans to address its threshold shares, Medicine has proposed leaving vacant positions unfilled (FY12), reducing the Dean’s salary by $60,000 (FY12), raising revenue through increased graduate and professional enrollment (FY14) and by increasing tuition (FY14), and by other administrative cuts (FY15).

PBB_Box3

A Word About Athletics

Conclusion

PBB is a blunt instrument, focused on short-term, year-to-year gains and losses, and often oblivious to long-term needs brought about by conditions which pre-existed it. The means by which colleges often have addressed the financial challenges imposed upon them—increasing tuition, fees, and class sizes, while keeping faculty hiring at a slow pace—are not beneficial for either students or faculty. Although the Administration appears at times to have provided relief to colleges when proposed cuts posed threats to their core academic missions, this only underscores that the clean, neat mathematical model of PBB is still fundamentally political. And those politics are embedded in the calculation of the “indirects”—the costs to run the rest of the university—which have skyrocketed. PBB thus emerges as an effective model for redistribution of resources away from the colleges, and away from the University’s core academic mission.

PBB - Support for Indirects Skyrockets from FY10 to FY15

PBB – Support for Indirects Skyrockets from FY10 to FY15

By: Stephanie Spanja, Director of Research, UC Chapter AAUP
With input from the UC Chapter AAUP Budget and Compensation Advisory Committee and approval of the UC Chapter AAUP Executive Council


Greg Loving, President UC-AAUP

Greg Loving, President UC-AAUP

President’s Corner

There’s a very expensive elephant in the room. Actually, the 86 million dollar renovation to Nippert Stadium could hold more than a few elephants. Throw in the just-approved 85 million dollar renovation to Fifth Third Arena, and we’ve got a growing herd of elephants. UC still has at least $1 billion in debt from past elephants. Very expensive elephants.

President Ono continues to say publicly that the university is in good financial shape, and that UC still wants to “invest in people.” When we get to the bargaining table in early 2016, I will be curious to hear what the story will be, and which people are deemed worthy of investment.

On the plus side, the university has hired over 200 new faculty, though at this point it is unclear what our net gain in faculty will be after counting retirements and those who left for other universities. Though the net gain is important, it merely staunches the bleeding in full time faculty lines we have experienced in the face of record enrollments.

On the negative side, athletics’ bottom line currently stays level by receiving $20 million a year from the academic side of the house. Many of our colleges wish they received this kind of grace under Performance Based Budgeting. The “investments” in Nippert and Fifth Third are positioned as ways for Athletics to become revenue neutral, if one adheres to Six Degrees of Kevin Bacon economic logic, and I certainly hope that is true eventually. Athletics are an important part of university culture, but at some point a reckoning must come if the rhetoric of self sufficiency means anything at all.

The athletic subsidy is more important when we consider opportunity cost. Whatever value the subsidy brings, it could also fund more robust student services such as counseling, racial and gender awareness, tutoring, lower tuition, and the list could go on. The subsidy could immediately bring adjunct professors to the level of equal pay for equal work. I would prefer it not pay for yet another Vice President.

The athletic subsidy could also fund competitive market raises across the board for full time faculty, who are woefully behind their peers. UC can’t afford to slip any farther behind its peers in salary and still claim to pursue excellence. Fortunately, the Joint Faculty Senate/Provost Committee has decided to examine faculty hiring and retention issues this academic year, and is on their way to making concrete recommendations.

Anecdotal though it is, the hiring committee I was most recently on lost one of our top candidates because of salary requirements, but hired the other top candidate largely because of UC’s benefits package. And yet what has the administration been doing over the last several contracts? Refusing to invest enough in faculty salaries to raise us even to the level of peer mediocrity, and at the same time doing everything it can to cut benefits.

UC actually does do very well competing with other universities in upper administrator salaries. UC Faculty salaries compared to the 62 AAU Schools? Dead last. President Ono’s salary compared to the 62 AAU Schools? #40. Faculty would need a 25% raise to reach a similar position.

Administrators tell us that it’s much easier to get money for buildings than it is people. I don’t deny that is true. There’s nothing wrong with buildings. People need buildings. But the very definition of excellence involves not settling for easy things. When buildings come at the expense of the people who use them, there’s a problem. And if your mantra is “invest in people,” then in this case the easy thing gets in the way. Life is hard enough without having to look out for elephants. (more…)

Education on the Cheap: Devaluing Students and Faculty (Part 2)

The real impact of UC’s increased student enrollment and the failure to prioritize instructional spending


Screen Shot 2015-06-15 at 1.00.45 PMIn the first part of “Education on the Cheap” (Works, Vol. 22, No. 3, 30 Mar. 2015), we looked at the impact of sharp increases in student enrollment (FTEs), flat levels of full-time faculty hiring, and budgetary pressures on three colleges: the McMicken College of Arts & Sciences, the College of Education, Criminal Justice and Human Services, and the College of Nursing. As we explained, while it is certainly useful to identify and discuss trends in enrollment and hiring on a University-wide level, there are limitations to such an approach, since these factors may—and do—impact the various colleges differently. Moreover, the colleges have responded to the these challenges in different ways.

Here, we will focus on three more colleges where student enrollment has, to varying degrees, outpaced full-time faculty (i.e., “bargaining unit”) hiring: the College of Business, the College of Allied Health Sciences, and the University of Cincinnati–Blue Ash. We again focus on two important questions: What do the trends in enrollment versus faculty hiring, in relation to budgetary pressures, mean for the average student? What has the day-to-day impact been on the average professor?


As we did for Part 1 of this series, we are using 2008-09 as our benchmark year, since FTEs Universitywide began to surge in 2009-2010, with a dramatic 7% increase in that year alone. Growth in FTEs has continued through the present, to the point where there are now 13.8% more FTEs at UC as of FY2014 than there were in FY2009 (or, in other words, 4,097 more students, for a total of 33,690 FTEs).1

The College of Business

The College of Business has seen enormous growth in its student FTEs, which rose from 2,772 for the 2008-09 academic year to 3,911 for the 2014-2015 academic year—a 41% increase. However, bargaining unit faculty hiring has not kept pace with FTE growth, increasing by 29% (from 75 in 2008-09 to 97 in 2004-15).2 As a result of this disproportion in student enrollment increases and bargaining unit faculty hiring, the FTE/faculty ratio rose from an already-high 37:1 in 2008-09 to 41:1 in 2014-15.

The impacts of this disproportion can be seen in the classroom. A faculty member commented: “The ability to provide quality education to our students is severely compromised by workloads which require maxing out student numbers in classrooms to achieve higher enrollments. For example, senior level undergrad classes with 60 students are common, which is the max number of students allowed in the classroom by fire code. I am confident if there were more large size classrooms available, they would pack them to capacity as well.” 3 Another member of the faculty at the College of Business stated: “Students have told me that they have many classmates who take all their classes in the auditorium which seats 300; paying adjuncts to teach these classes and collecting tuition from 300 students is nice arithmetic for the college, but I don’t think this is what these students were expecting when they enrolled here.” Had the rate of bargaining unit faculty hiring matched the rate of increase in FTEs, there would be 8 additional bargaining unit faculty at the College of Business today. Instead of maintaining its proportion of full-time faculty, and attempting to lower what was already a fairly high student FTE/bargaining unit faculty ratio, however, the College of Business, like several other colleges at UC, is relying heavily upon unrepresented part-time and visiting faculty. In 2008-09, there were 39 unrepresented part-time and visiting faculty at the College of Business, who together made up 34% of the total Business faculty. By 2014-2015, there were 118 unrepresented part-time and visiting faculty at the College of Business, who together constituted 55% of the faculty at the College.4 So, in a mere 7 years, part-time and visiting faculty went from a little over a third of the faculty at Business to well over half.

Chart I

Chart1

Perhaps not coincidentally, the proportion of the College of Business’s unrestricted funds dedicated to Instruction dropped from 70% in 2008-09 to 64% in 2013-14, while the proportion dedicated to “Academic Support”—which includes the Dean’s office—rose from 18% to 23% over the same time period.5


The College of Allied Health Sciences

Student FTE growth at the College of Allied Health Sciences has surpassed even that at the College of Business: Student FTEs rose from 1,432 for the 2008-09 academic year to 2,305 in 2014-15, a 61% increase. The numbers of ful-time (i.e., bargaining unit) faculty, however, have lagged far behind, rising only from 57 to 63—a 10.5% increase over the same time period.6 As a result, the FTE/bargaining unit faculty ratio has grown from 25:1 to 36:1 over this time period. Not surprisingly, throughout this time period Allied Health’s reliance on unrepresented part-time and visiting faculty has grown. Whereas in 2008-09, unrepresented part-time and visiting faculty comprised an already-high 66% of total faculty, by 2014-15, this proportion had risen to 70%.7

“This is all tied in with distance learning,” commented a faculty member in Allied Health. “The models for distance learning are adjunct-driven. Online classes can have as many as 200-250 students, with a faculty member as instructor and ‘facilitators’ to assist the faculty member.” Another faculty member from Allied Health commented: “On-line teaching doesn’t receive the associated support it should for the revenue it generates. Teaching an on-line course with a large enrollment offers significant challenges, as the faculty member is addressing issues that run the gamut from academic and IT to natural disasters in other parts of the country.” This faculty member further noted: “There is a need to hire full-time faculty to teach online courses, since when these course are directed by adjunct faculty, many of the typical course issues, such as academic misconduct, dealing with personal and family issues, exam problems and IT issues, still fall back on the full-time faculty in these programs to resolve.”

Chart II

Chart2
The percentage of unrestricted college funds dedicated to Instruction in the College of Allied Health Sciences plunged from 76% to 59% from FY09 to FY14, while the percentage of unrestricted funds dedicated to “Academic Support” (primarily the Dean’s office) has grown from approximately 10% to 17% over this same time period.8


The University of Cincinnati–Blue Ash

The situation at UC Blue Ash is nowhere near as dire or extreme as that at Business or Allied Health. However, even there, the pace of bargaining unit faculty hiring is beginning to fall behind the growth in student FTEs. Student FTEs at UC Blue Ash jumped from 2,891 in 2008-09 to 3,718 in 2014-15, a 28% increase, while full-time (i.e., bargaining unit) faculty rose by 15%, from 143 to 165, over the same period.9 This resulted in a relatively small increase in the the student/ bargaining unit faculty ratio, from 20:1 to 22:1. Over this same period, the unrepresented part-time anvisiting faculty at UC Blue Ash constituted the majority of total faculty body, though the percentage proportion dropped very slightly, from 58.9% to 57.5%.10

However, even there, the pace of bargaining unit faculty hiring is beginning to fall behind the growth in student FTEs.

Student FTEs at UC Blue Ash jumped from 2,891 in 2008-09 to 3,718 in 2014-15, a 28% increase, while full-time (i.e., bargaining unit) faculty rose by 15%, from 143 to 165, over the same period.9 This resulted in a relatively small increase in the the student/ bargaining unit faculty ratio, from 20:1 to 22:1. Over this same period, the unrepresented part-time and visiting faculty at UC Blue Ash constituted the majority of total faculty body, though the percentage proportion dropped very slightly, from 58.9% to 57.5%.10

Chart III

Chart3

A faculty member at UC Blue Ash commented: “I’m concerned about the heavy use of adjuncts at our college and in my department. My understanding is that adjuncts here make less than they do on main campus, even if they’re teaching the same class. That seems wrong to me. In my department, I know of several part-time adjunct faculty who are stringing together positions at two or three institutions. They end up teaching double what a full-time faculty member does at UCBA. Our adjuncts are great, but how can they succeed under those working conditions?”


More to Come

In Parts 1 and 2 of this article, we we have presented the basic numbers, drawn from the University’s own data, that by themselves tell the story of lagging bargaining unit hiring in the face of significant enrollment increases. We have offered commentary from faculty members about how these disproportions are experienced “on the ground” by faculty members, and how they impact the student experience at UC. It is one thing to describe what is happening. It is another to say why. To tell this part of the story, in an upcoming iussue of Works we will be examining the Performance Based Budgeting process in even greater depth than in our previous piece, “Performance Based Budgeting, Five Years Later: The Real World Effects of ‘Transparency,”

Works, Vol. 21, No. 7, 7 Nov. 2014. As we will discuss, these outcomes are not accidental by-products of this budgeting system, but are built into it, with significant negative consequences for both faculty and students.

END NOTES

1. Office of Institutional Research, Student Enrollment Reports.

2. Office of Institutional Research, Student Enrollment Reports; Main Campus Faculty Headcount by College.

3. In light of the sensitivity of these issues, faculty members who have provided comments for this article have not been identified.

4. Office of Institutional Research, Main Campus Faculty Headcount by College.

5. Supplemental Schedules to the Annual Financial Audit for the Year Ended June 30, 2009; Annual Fund Accounting Schedules for the Year Ending June 30, 2014.

6. Office of Institutional Research, Student Enrollment Reports; Main Campus Faculty Headcount by College.

7. Ibid.

8. Supplemental Schedules to the Annual Financial Audit for the Year Ended June 30, 2009; Annual Fund Accounting Schedules for the Year Ending June 30, 2014.

9. Office of Institutional Research, Student Enrollment Reports.

10. Office of Institutional Research, Employee Headcount.

Tackling the Roots of the Tuition/Debt Crisis

Without basic operating support from State, costs continue to rise

education_costsThe last issue of Works featured an article, Mortgaging Future Generations, Holding Back the Economy, on the crippling problems of rising college cost and increased student debt. Recently there has been increased attention on this subject at the University of Cincinnati and across the country. Unfortunately, as this article will discuss, the remedies that have been proposed to date are largely superficial; they have dealt with the symptoms of the problem, but have not focused on the causes of the problem: decades of deep and ongoing cuts to higher education funding from state legislature, and exploding administrative costs and physical plant expansions. The disinvestment of state legislatures has helped to create the climate for the second problem; by starving higher education systems of basic operational funding, state legislatures have abandoned their role as “budget watchdogs” and left higher education administrators to cover the deficits through fundraising and “campus enhancements.” John Carey, chancellor of the Ohio Board of Regents, visited UC on January 28th to participate on a roundtable to discuss means of making higher education more affordable in Ohio. The roundtable was billed as a precursor to Governor Kasich’s 2016–18 budget announcement. UC President Santa Ono, Cincinnati State PresidentO’Dell Owens, students, and parents participated. The roundtable discussed some innovative programs that theoretically would result in cost savings. Many of these are admirable and deserving of study, but unfortunately the conversation did not examine the fundamental relationship between the increased cost of college for students and their families and the legislative funding cuts to higher education budgets.

Many faculty members attended the roundtable andtook the opportunity to listen and to give feedback. Cynthia Ris, Associate Professor Educator in A&S, was quoted by the local television station WCPO: “I’m very impressed by all the talk about cost cutting, but I have lots of questions about what the state of Ohio will be funding. I see a lot of students under great stress working 20, 30 or 40 hours a week [to pay tuition and costs].” Click Here to See Article

The UC administration did arrange for, and the chancellor agreed to, a short meeting with faculty after the event. This offered faculty a chance to discuss possible state cuts directly with the chancellor, particularly the impact on students. The chancellor listened attentively and encouraged the faculty to be actively involved in the budget process. Governor Kasich released his proposed $72.3 billion 2016-2018 budget on February 2nd (subsequently introduced to the Ohio House of Representatives in the form of HB 64). The governor’s budget proposes:

  1. • 23% across-the-board cut in the personal income tax
  2. •$2.4 billion to higher education funding in FY 2016 (a 2% increase over 2015)
  3. •$2.5 billion to higher education funding in FY 2017 (a 2.5% increase over 2016)
  4. •2% cap on tuition increases in FY 2016 and a freeze on tuition in FY 2017.
  5. •$120 million debt relief fund for students, centered around those engaged in low-income, “in demand” jobs
  6. •Nine-member Task Force on Affordability and Efficiency that will be charged with reducing costs at Ohio’s colleges and universities.

The governor’s budget represents an attempt to deal with the problem of increasing college cost and student debt. Also, it also does not contemplate the kind of virtual dismemberment of the state’s higher education system that has been proposed this month in Wisconsin. (See Walker Decimates Higher Education and Walker Forced to Admit UW Objected to Wisconsin Idea Changes.) A closer examination, however, reveals that the governor’s proposed budget still fails to deal with the core issue of the decline in state funding for basic operations in the state colleges and universities.

The proposal of yet another round of cuts to the personal income tax (23% across the board cut) is part of a trend that began in 2005 under then Governor Bob Taft. Over the past 10 years, those tax cuts have resulted in a $2.5 billion dollar loss in revenue, with no discernible positive impact on job creation. This lost revenue puts growing pressure on the state budget, resulting in reduced appropriations to higher education—and, therefore, increased tuition and higher student debt. (See AAUP 2015 Ohio Higher Education Report, The Real Problems Deserve Real Solutions).

And although the governor’s budget does call for modest increases in FY 2016 and 2017, this in no way compensates for the last decade of cuts. In 2002, just 25.09% of the revenue came from state appropriations. In 2013—just 11 years later—that percentage had plummeted to 12.8%. (Id.). The corresponding effect on tuition is clear. According to The Cleveland Plain Dealer, the average cost of college tuition was $3,431 per year in 1981. Had university costs remained stable, and if tuition had kept pace with inflation, it would currently be $8,000 per year. Instead tuition averages nearly $19,000 per year in Ohio.

That the governor has also enacted a Task Force on Affordability and Efficiency is interesting, and it could probably identify some issues to explore. As past Works articles have pointed out, the dramatic increases in spending on administrative functions, and the corresponding decreases in spending on instruction and the academic mission, are the core problems. In Ohio there is now one administrator for every 14 students, an increase of 25% over the last 10 years. Ohio universities are now employing as many administrators as full-time faculty. This is the area where reductions must be made—but some of those cuts will be difficult unless the legislature commits to re-engaging in its traditional role as the primary funder of basic university operations, and therefore its de facto cost oversight role. If the Task Force is composed of the same administrators who have overseen the dramatic increase in college costs, and decreases in instructional spending, it’s hard to foresee how productive solutions can be proposed. As of now, that appears to be the composition of the Task Force. It also must be noted that the Task Force is being chaired by the chief financial officer at Ohio State. The administration of Ohio State—known for the $6 million dollar Gordon Gee salary—has not been a model of efficiency. If the task force is truly going to be productive it must include faculty and students, the two groups that are closest to and most impacted by the problem.

The governor’s budget proposal, with its increased focus on the cost of college and student debt, is an important step in the right direction. But the conversation in Columbus must evolve and progress to the next steps, and focus on the state cuts to higher education as the underlying cause of the problem. Some policymakers are willing to take this next step in the conversation. Others are not. It will take a great deal of work to prevent further cuts and, over time, restore the devastating disinvestment policies that imposed over the past 20 years.

The AAUP will be involved in this process, actively advocating for higher education funding during state budget deliberations. In coordination with the Ohio Conference of the AAUP, the UC Chapter will be meeting with state representatives, state senators, and members of the Governor’s administration. Please watch for updates and calls for action over the next 2 months as the state’s FY16-17 budgetdeliberations unfold.