4Click to read to read Leadership Corner
CLick to read to read UC’s FY18 Budget Plan
CLick to read to read Distance Learning Programs: Who Profits?
CLick to read to read 2017 Salary Increases
 ARE YOU AN AAUP-UC MEMBER?
Best wishes at the outset of Fall Semester. We hope that this Academic Year is productive and rewarding.
At the advent of a new semester, we want to highlight the many services the AAUP-UC Chapter provides to faculty. The AAUP-UC is probably most recognized every three years, when a team of faculty assisted by Chapter staff negotiates the Collective Bargaining Agreement (CBA). The CBA is critically important. Without it, the administration could make unilateral changes to faculty working conditions, including wages and benefits. Unfortunately, UC has done just that to its unrepresented employees.
However, the CBA is just part of what the AAUP-UC does every year. AAUP-UC elected faculty leaders and Chapter staff work with faculty members on all aspects of implementing and enforcing the CBA, and assist faculty when grievances arise. Grievances can occur over discipline, reappointment, promotion and tenure, research integrity issues, or any matter covered by the CBA. AAUP-UC staff assists and accompanies faculty to mediations, arbitrations, and grievance panel hearings. In the last Academic Year, AAUP-UC staff handled over 140 grievances and responded to nearly 300 additional calls from faculty with questions regarding the CBA and related issues.
AAUP-UC committees, composed of faculty and supported by staff, are active throughout the year as well. The Contract Compliance and Education Committee (CCE) provides education about the CBA to Chapter members, Bargaining Unit members, and members of the administration, including conducting numerous workshops for RPT candidates, RPT reviewers, Unit Heads, and new faculty.
The Budget and Compensation Committee (BCC) conducts a thorough analysis of UC’s budget and highlights problems with spending priorities in articles in Works, the AAUP-UC newsletter. These articles are read widely by the faculty and the administration. This committee also is charged with assisting the AAUP-UC Chapter’s Executive Council and Negotiating Team with budget analysis and the costing of proposals during contract negotiations.
The Political Action Committee (PAC) monitors current political, social, and academic freedom issues that may impact faculty members (e.g. civil rights and equal rights of women, family or LGBT issues; national and state legislation that affects higher education or union bargaining rights; threats to academic freedom on or off campus; State of Ohio budgeting for higher education institutions; Ohio Board of Regents activities and policies). PAC partners with student groups and other campus unions, and has spearheaded several initiatives to raise awareness of issues that impact students and faculty. The PAC also organizes lobbying days in Columbus and, working with the Ohio and National AAUP, in Washington D.C.
The AAUP-UC Chapter also works closely with the Ohio Conference AAUP (OCAAUP) and AAUP chapters across the state to beat back anti-faculty bills in the Ohio legislature that would have reduced sick leave; mandated annual disclosure filing requirements for faculty who assign textbooks to their classes; and required all Ohio universities to review their tenure policies.
Our chapter, then, looks to serve faculty not only by improving the conditions within which we work, but, also, by actively advancing the values that inform and inspire this work in the first place. We as faculty enter this profession because we believe in creating an educated society, and the AAUP-UC Chapter is here to help us achieve this goal.
If you are not a member, support these and other initiatives by joining the AAUP-UC Chapter today.
If you are not sure if you are an AAUP member, contact the AAAP-UC office by emailing aaupuc1@ucmail.uc.edu or calling (513) 556-6861.
Some faculty confuse the “fair share” fee with AAUP-UC Chapter membership. All members of the bargaining unit pay a “fair share” fee, to help bear the cost of representation—as all faculty receive the benefits and protections of the CBA. This is not the same as being a member of the AAUP-UC Chapter.
The difference between the fair share fee and actual membership is minimal. (Click here for a chart demonstrating the difference and other information about membership.) But the impact of membership is tremendous. A large membership makes the Chapter a stronger and a better advocate for the faculty.
Only full AAUP-UC members can attend membership meetings, vote on the CBA, participate in AAUP-UC Chapter committees, and attend Ohio and National AAUP conferences and events.
Chris Campagna Cassie Fetters
Chair, Associates Council Vice Chair, Associates Council
Chris Campagna (A&S) and Cassie Fetters (UC-Clermont College) are Chair and Vice Chair of the Associates Council. The Associates Council is a representative assembly and functions as a liaison between the faculty and the Executive Council. Representatives are elected at the college/library level.
 UC’s FY18 Budget Plan: A Look at the Year Ahead
Every year in June, the UC Board of Trustees approves the University’s Current Funds Budget Plan for the following fiscal year. The Budget Plan is both a document in which the Administration explains how it intends to spend the University’s money in the coming fiscal year, and an exercise in public relations—highlighting the University’s achievements in the preceding year and articulating its aspirations for the near future.
Since the Budget Plan is only a “plan” and not a contract, the Administration is not obligated to follow it to the letter, and it frequently makes upward or downward adjustments in spending as it deems necessary throughout the year. Even so, the Budget Plan can yield valuable information and insights into the Administration’s budget priorities for the following fiscal year. We can get a sense of these priorities by comparing the Administration’s projected spending from year-to-year (FY2017 to FY2018) and by taking a longer view, with a ten-year snapshot (FY2009 to FY2018). Moreover, when we consider where the money is coming from—and how that has changed over the past ten years—as well as the increase in student full-time equivalents (FTEs) over the same time period, the trend away from investment in the University’s academic mission that we will see below is even more troubling.
Where the Money Is Coming From: A Sea Change in a Decade
Each Budget Plan includes a pie chart showing the sources of the University’s revenue and their respective percentages of the whole. “Auxiliary Enterprises” refers primarily to Campus Services, which oversees “Parking, Housing & Food Services, Retail Services, MainStreet & Campus Recreation Operations, Kingsgate Conference Center, and Conference & Event Services”; Intercollegiate Athletics is also included in this category.[i] “Other Resources” is not defined, but likely includes private gifts and endowment income, among other sources.
Chart I – Sources of Revenue, FY2009 and FY2018 Compared

Chart I shows that the percentage of revenue from tuition and fees has increased by nearly 10%, now comprising 38% of the University’s revenues, while revenue from Ohio state appropriations has declined to 17% of the total. This reflects the long-term national decline in state support for public higher education, which fell by 16% per student from the 2007-2008 academic year to the 2016-2017 academic year, a decline which was mirrored in Ohio, where per-student funding fell by 15.2% over the same time period.[ii]
The growth in revenue from tuition and fees reflects not only increases in the amounts charged for each (and, with respect to fees, in the multiplying numbers of program-specific fees), but also the increase in FTEs over a similar span. At the start of academic year 2008-2009, UC had 29,594 FTEs; by 2016-2017 (the most recent year available), FTEs had grown by 16.4%, to 34,476. As Charts II and III below demonstrate, budgeting for the University’s core academic mission has failed to keep pace with the growth in student enrollment.
Where the Money Is Going: Two Different Snapshots That Tell the Same Story
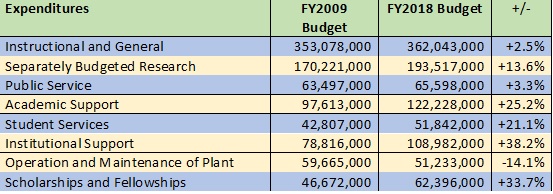
Below are two perspectives on the FY2018 budget: a year-to-year comparison with the FY2017 budget, and a ten-year comparison with the FY2009 budget. Both tell the same and, by now, very familiar story: budgets for Academic Support (which includes Academic Administration and Deans’ offices) and Institutional Support (which includes other administrative offices, such as Finance, the President’s Office, and Human Resources) have increased by much higher rates than the budget for Instructional and General, which supports UC’s faculty, who carry out UC’s academic mission.[iii]
Chart II – Comparing Budgeted Expenditures from FY2017-FY2018

Chart III – Comparing Budgeted Expenditures from FY2009 to FY2018

FY2009 adjusted for inflation using the CPI Inflation Calculator: https://data.bis.gov/cgi-bin/cpicalc.pl
Given the tremendous growth in UC’s FTEs over the past decade, it is only appropriate that there should have been significant increases in the budgets for Student Services and Scholarships and Fellowships over the same period.
However, the fact that the budget for Instruction increased by only 2.5%, while the budgets for the administrative sectors—Academic Support and Institutional Support—increased by over 25% and 38%, respectively, is very concerning. From FY2009 to FY2017, the number of full-time represented faculty remained essentially flat (dropping slightly from 1,728 to 1,726). Had the numbers of full-time bargaining unit faculty kept pace with the growth in FTEs, there would be 283 more full-time bargaining unit faculty now than there are today. The failure to invest in hiring full-time bargaining faculty has had significant impacts on the University’s academic mission, with a heavier reliance on adjunct faculty, increasing class sizes and heavier student advising loads for full-time faculty.[iv] In addition, the pressures imposed upon colleges by the Performance Based Budgeting process, with the increasingly higher “tax” to support the non-revenue generating (e.g., administrative) sectors, impedes the ability of colleges and academic units to maintain and build their full-time faculty.[v]
Conclusion
Glossy budget plans designed for public consumption cannot paper over the on-the-ground realities faculty and students face as a result of the failure to reinvest in the University’s core academic mission. The numbers speak for themselves: there are more students, who are paying higher tuition and more fees than they were 10 years ago. But the number of full-time bargaining unit faculty who actually carry out the academic mission of this University has remained flat. All this begs the question: are students really getting what they are paying for?
[i] University Current Funds Budget Plan 2017-2018 at 15. www.uc.edu/af/budgetfinsvcs/budgetmgt.html.
[ii] “A Lost Decade in Higher Education Funding: State Cuts Have Driven Up Tuition and Reduced Quality,” Center on Budget and Policy Priorities, Aug. 23, 2017, pp. 4, 5.
[iii] University Current Funds Budget Plan 2017-2018, 2016-2017, and 2008-2009, www.uc.edu/af/budgetfinsvcs/budgetmgt.html. Note that while the “Academic Support” category also includes the Libraries, one of our previous investigations of University spending showed that spending on Libraries had actually declined from FY2009 to FY2014. “Where Is the Money Going? An In-depth Look at University Expenditures (Part I of II),” Works, Vol. 22.6, 23Nov2015. Given that trend, it is highly unlikely that the increases in spending on Academic Support reflected in Charts II and III are attributable to the Libraries.
[iv]These impacts were documented in “Education on the Cheap: Devaluing Students and Faculty, Parts I and II,” Works, 22.3, 30 March 2015, and 22.4, 27 May 2015.
[v] See “PBB: The High Cost of Efficiency,” Works, 22.5, 3 Sept. 2015, and “Performance Based Budgeting, Seven Years Later: Decision-Making Inside the Black Box,” Works, 24.3, 9 May 2017
—Stephanie Spanja, J.D.
Director of Research, UC Chapter AAUP

Distance Learning Programs: Who Profits?
Distance learning courses and programs provide flexibility to students working towards completion of degrees. These courses and programs are useful for a range of students, from those who are working full-time to those who live at a distance. Because they do not require physical classroom space, distance learning courses and programs lessen certain overhead costs to institutions of higher education. There has been tremendous growth in online offerings at the University of Cincinnati (UC) since 2010. UC currently has “more than 30 online degree programs and 40 online certificate programs, in addition to many fully online general education and professional development courses.”1 UC is moving to an in-house enterprise system called Cincinnati Online as a marketing, recruitment, and retention/advising service for distance learning programs. It is the intent of the article to explore why and what kind of impact these enterprises have had and may have on the university. The key questions include at what instructional expense are these used and who is making decisions about these enterprises.
Not only has UC profited from the growth of distance learning degree and certificate programs, but corporations who provide services to UC related to these programs also appear to have reaped significant profits. Numerous degree programs housed in a few UC colleges have contracted with companies such Embanet-Compass Knowledge (owned by Pearson) and Academic Partnership for marketing and recruitment services for distance learning programs. We submitted a public records request to determine how much these services cost and what percentage of tuition revenue is taken by the service provider. Although much information was redacted from the contracts UC provided to us, we were able to determine that the operating expenditures designated as “Distance Learning Support”(in the detail for UC’s Annual Fund Accounting Schedules) are payments to these providers. We were also able to determine from our public records request that for programs contracting with Embanet-Compass Knowledge, these payments represent 40% to 50% of tuition paid by those students recruited by the service provider. The percentage depends on the number of students recruited.
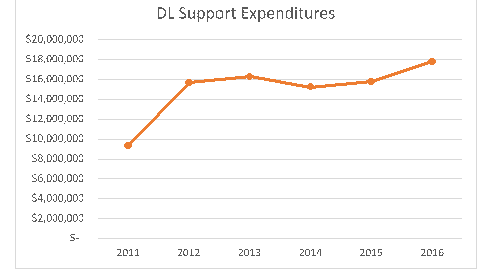
“Distance Learning Support” first appeared as an expenditure in the Annual Fund Accounting Schedules in 2011, although UC programs contracted with Pearson (originally Compass Knowledge, then Embanet-Compass Knowledge) much earlier. From the graph below of administrative unit Distance Learning Support expenditures, one can see payments to these providers has increased from about $9 million in the academic year ending 2011 to almost $18 million in 2016 (not adjusted for inflation).

The significant amount of these expenditures begs the question: how can these programs be profitable or even break even when they are receiving only half of the tuition for the students in these programs? It is difficult to pinpoint how decisions about how courses and programs are made to respond to costs—for example decisions about class sizes and number of faculty needed—because these decisions are made on a programmatic basis and would not be reflected on a publically available accounting schedule.
Perhaps the limitations of engaging external service providers has reached its limits. An in-house marketing, recruitment, and retention/advising service has been developed: Cincinnati Online (http://online.uc.edu/). This non-profit entity was initiated by the College of Education, Criminal Justice, Human Services, and Information Technology (CECH) and the College of Nursing (CoN). It was piloted in University of Cincinnati Research Institute (UCRI). It is to be housed within the Office of the Provost and will be headed by a Vice Provost. The first search for this new administrative position was unsuccessful. CECH Dean Larry Johnson and Senior Vice Provost of Academic Affairs Eileen Strempel are co-chairs of Cincinnati Online initiative, which as of this writing, has yet to be fully launched. Governance and oversight has not yet been finalized.
The Cincinnati Online initiative stands to generate substantial revenues for the university. Because of its potential impact not only financially but on decisions related to teaching and learning, it is important to ensure that questions are addressed before this initiative is fully launched. These questions should include how revenues will be invested and how instructional expenditures will be affected as well as who will be at the table when these decisions are made. On May 14, 2015 the UC Faculty Senate put forth a resolution involving distance education. Will it be considered as Cincinnati Online’s structure is developed? Input from an inclusive group of stakeholders, including faculty, will ensure that the university benefits not only financially but also in terms of strengthening its core academic mission and in terms of reflecting various disciplinary needs of colleges throughout the university.
1 http://www.uc.edu/distance/courses_programs.html
Sarai Hedges, Chair, Budget & Compensation Advisory Committee, UC Chapter AAUP
 AAUP Faculty Annual Salary Increases Effective September 1st
Current faculty who were part of the AAUP Bargaining Unit on or before June 30, 2017 will see annual Across the Board Increases reflected in their upcoming September 29th payroll statement. Per Article 10.1.2 of the Collective Bargaining Agreement, the across-the-board component of the annual salary increase will equal 2% of base salary.
In addition, per Article 10.2, faculty will receive a Compression Adjustment—the aim of which is to address the problem that occurs when salaries of current faculty fail to keep pace with those of recent faculty hires. The compression adjustment is higher the more years of service a faculty member has at UC, up to a maximum of 12 years. To calculate what your compression adjustment will be, follow this link and input the requested information: http://homepages.uc.edu/~pelikas/Compression.html
The 2016–2019 Collective Bargaining Agreement also includes, for the first time, Benchmark Increases. “Benchmark” refers to the Provost Office’s list of UC’s peer or aspirational “benchmark” institutions. The Bargaining Team devised the benchmark increase to help bring UC faculty more in line with these institutions. The increases are flat dollar amounts that are the same for all faculty members, based on a percentage (.25% for 2017) of the average salary for UC faculty. For 2017, the Benchmark Increase is $231.
Finally, regional campus faculty, whose salaries continue to lag well behind those of their counterparts across the state, will receive an additional increase of 1.5%.
