The real impact of UC’s increased student enrollment and the failure to prioritize instructional spending
 In the first part of “Education on the Cheap” (Works, Vol. 22, No. 3, 30 Mar. 2015), we looked at the impact of sharp increases in student enrollment (FTEs), flat levels of full-time faculty hiring, and budgetary pressures on three colleges: the McMicken College of Arts & Sciences, the College of Education, Criminal Justice and Human Services, and the College of Nursing. As we explained, while it is certainly useful to identify and discuss trends in enrollment and hiring on a University-wide level, there are limitations to such an approach, since these factors may—and do—impact the various colleges differently. Moreover, the colleges have responded to the these challenges in different ways.
Here, we will focus on three more colleges where student enrollment has, to varying degrees, outpaced full-time faculty (i.e., “bargaining unit”) hiring: the College of Business, the College of Allied Health Sciences, and the University of Cincinnati–Blue Ash. We again focus on two important questions: What do the trends in enrollment versus faculty hiring, in relation to budgetary pressures, mean for the average student? What has the day-to-day impact been on the average professor?
As we did for Part 1 of this series, we are using 2008-09 as our benchmark year, since FTEs Universitywide began to surge in 2009-2010, with a dramatic 7% increase in that year alone. Growth in FTEs has continued through the present, to the point where there are now 13.8% more FTEs at UC as of FY2014 than there were in FY2009 (or, in other words, 4,097 more students, for a total of 33,690 FTEs).1
The College of Business
The College of Business has seen enormous growth in its student FTEs, which rose from 2,772 for the 2008-09 academic year to 3,911 for the 2014-2015 academic year—a 41% increase. However, bargaining unit faculty hiring has not kept pace with FTE growth, increasing by 29% (from 75 in 2008-09 to 97 in 2004-15).2 As a result of this disproportion in student enrollment increases and bargaining unit faculty hiring, the FTE/faculty ratio rose from an already-high 37:1 in 2008-09 to 41:1 in 2014-15.
The impacts of this disproportion can be seen in the classroom. A faculty member commented: “The ability to provide quality education to our students is severely compromised by workloads which require maxing out student numbers in classrooms to achieve higher enrollments. For example, senior level undergrad classes with 60 students are common, which is the max number of students allowed in the classroom by fire code. I am confident if there were more large size classrooms available, they would pack them to capacity as well.” 3 Another member of the faculty at the College of Business stated: “Students have told me that they have many classmates who take all their classes in the auditorium which seats 300; paying adjuncts to teach these classes and collecting tuition from 300 students is nice arithmetic for the college, but I don’t think this is what these students were expecting when they enrolled here.” Had the rate of bargaining unit faculty hiring matched the rate of increase in FTEs, there would be 8 additional bargaining unit faculty at the College of Business today. Instead of maintaining its proportion of full-time faculty, and attempting to lower what was already a fairly high student FTE/bargaining unit faculty ratio, however, the College of Business, like several other colleges at UC, is relying heavily upon unrepresented part-time and visiting faculty. In 2008-09, there were 39 unrepresented part-time and visiting faculty at the College of Business, who together made up 34% of the total Business faculty. By 2014-2015, there were 118 unrepresented part-time and visiting faculty at the College of Business, who together constituted 55% of the faculty at the College.4 So, in a mere 7 years, part-time and visiting faculty went from a little over a third of the faculty at Business to well over half.
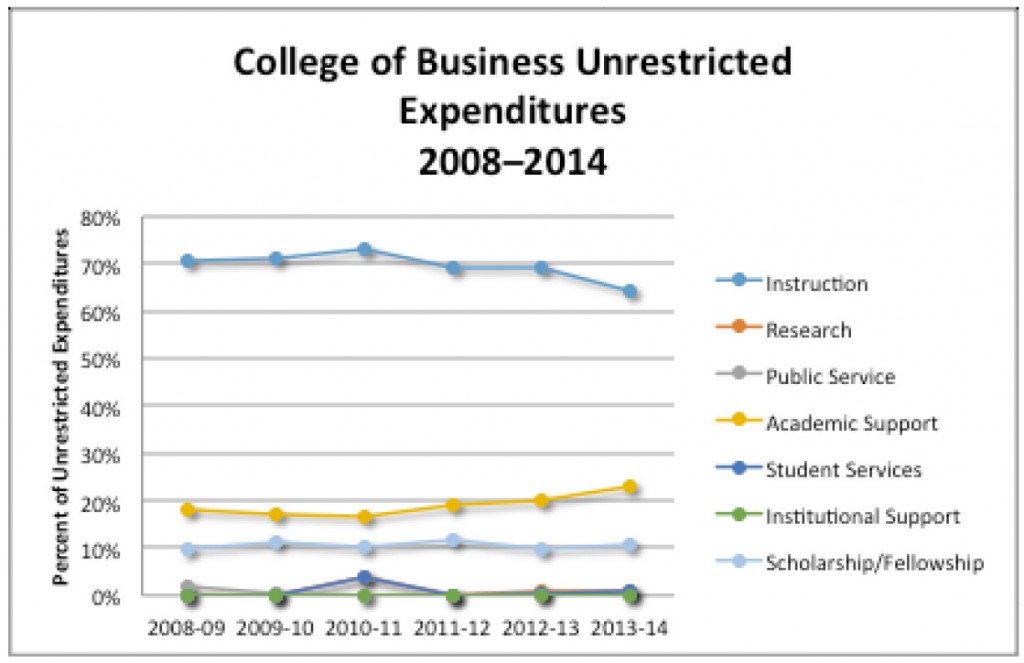
Chart I

Perhaps not coincidentally, the proportion of the College of Business’s unrestricted funds dedicated to Instruction dropped from 70% in 2008-09 to 64% in 2013-14, while the proportion dedicated to “Academic Support”—which includes the Dean’s office—rose from 18% to 23% over the same time period.5
The College of Allied Health Sciences
Student FTE growth at the College of Allied Health Sciences has surpassed even that at the College of Business: Student FTEs rose from 1,432 for the 2008-09 academic year to 2,305 in 2014-15, a 61% increase. The numbers of ful-time (i.e., bargaining unit) faculty, however, have lagged far behind, rising only from 57 to 63—a 10.5% increase over the same time period.6 As a result, the FTE/bargaining unit faculty ratio has grown from 25:1 to 36:1 over this time period. Not surprisingly, throughout this time period Allied Health’s reliance on unrepresented part-time and visiting faculty has grown. Whereas in 2008-09, unrepresented part-time and visiting faculty comprised an already-high 66% of total faculty, by 2014-15, this proportion had risen to 70%.7
“This is all tied in with distance learning,” commented a faculty member in Allied Health. “The models for distance learning are adjunct-driven. Online classes can have as many as 200-250 students, with a faculty member as instructor and ‘facilitators’ to assist the faculty member.” Another faculty member from Allied Health commented: “On-line teaching doesn’t receive the associated support it should for the revenue it generates. Teaching an on-line course with a large enrollment offers significant challenges, as the faculty member is addressing issues that run the gamut from academic and IT to natural disasters in other parts of the country.” This faculty member further noted: “There is a need to hire full-time faculty to teach online courses, since when these course are directed by adjunct faculty, many of the typical course issues, such as academic misconduct, dealing with personal and family issues, exam problems and IT issues, still fall back on the full-time faculty in these programs to resolve.”
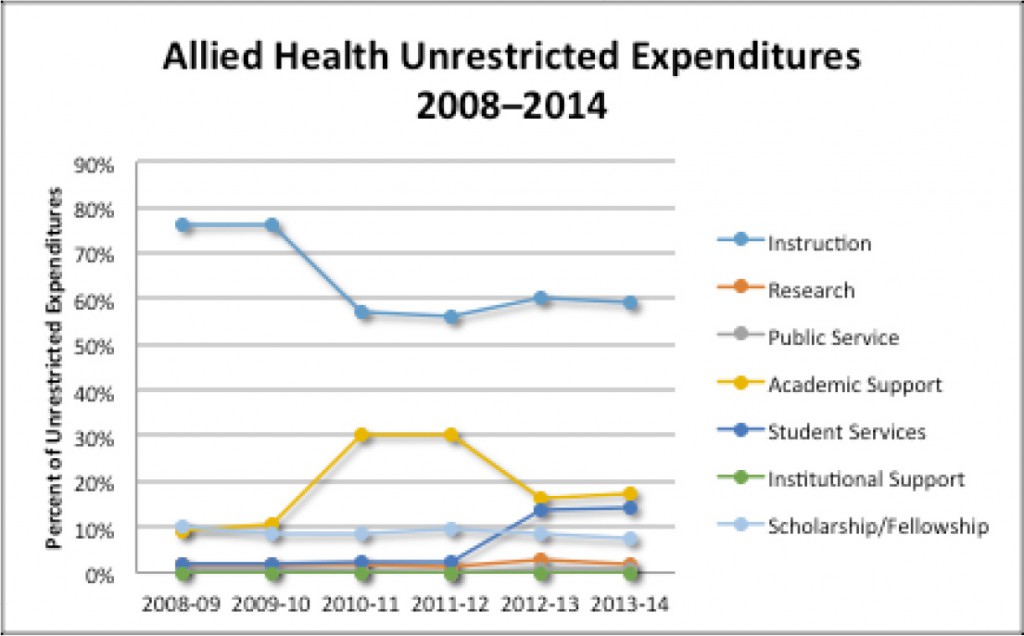
Chart II

The percentage of unrestricted college funds dedicated to Instruction in the College of Allied Health Sciences plunged from 76% to 59% from FY09 to FY14, while the percentage of unrestricted funds dedicated to “Academic Support” (primarily the Dean’s office) has grown from approximately 10% to 17% over this same time period.8
The University of Cincinnati–Blue Ash
The situation at UC Blue Ash is nowhere near as dire or extreme as that at Business or Allied Health. However, even there, the pace of bargaining unit faculty hiring is beginning to fall behind the growth in student FTEs. Student FTEs at UC Blue Ash jumped from 2,891 in 2008-09 to 3,718 in 2014-15, a 28% increase, while full-time (i.e., bargaining unit) faculty rose by 15%, from 143 to 165, over the same period.9 This resulted in a relatively small increase in the the student/ bargaining unit faculty ratio, from 20:1 to 22:1. Over this same period, the unrepresented part-time anvisiting faculty at UC Blue Ash constituted the majority of total faculty body, though the percentage proportion dropped very slightly, from 58.9% to 57.5%.10
However, even there, the pace of bargaining unit faculty hiring is beginning to fall behind the growth in student FTEs.
Student FTEs at UC Blue Ash jumped from 2,891 in 2008-09 to 3,718 in 2014-15, a 28% increase, while full-time (i.e., bargaining unit) faculty rose by 15%, from 143 to 165, over the same period.9 This resulted in a relatively small increase in the the student/ bargaining unit faculty ratio, from 20:1 to 22:1. Over this same period, the unrepresented part-time and visiting faculty at UC Blue Ash constituted the majority of total faculty body, though the percentage proportion dropped very slightly, from 58.9% to 57.5%.10
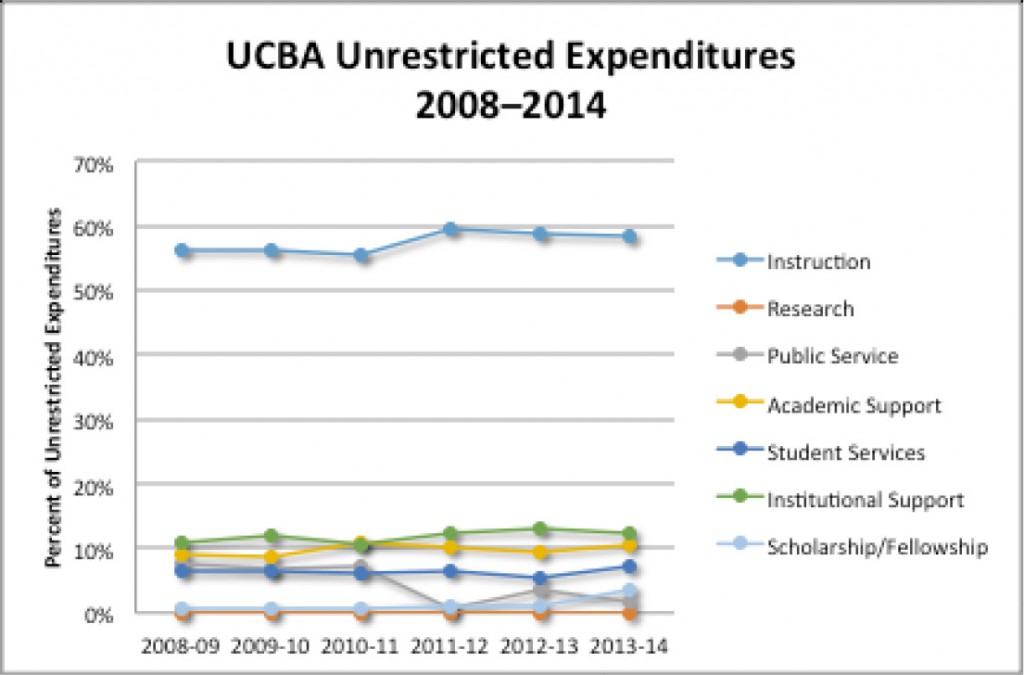
Chart III

A faculty member at UC Blue Ash commented: “I’m concerned about the heavy use of adjuncts at our college and in my department. My understanding is that adjuncts here make less than they do on main campus, even if they’re teaching the same class. That seems wrong to me. In my department, I know of several part-time adjunct faculty who are stringing together positions at two or three institutions. They end up teaching double what a full-time faculty member does at UCBA. Our adjuncts are great, but how can they succeed under those working conditions?”
More to Come
In Parts 1 and 2 of this article, we we have presented the basic numbers, drawn from the University’s own data, that by themselves tell the story of lagging bargaining unit hiring in the face of significant enrollment increases. We have offered commentary from faculty members about how these disproportions are experienced “on the ground” by faculty members, and how they impact the student experience at UC. It is one thing to describe what is happening. It is another to say why. To tell this part of the story, in an upcoming iussue of Works we will be examining the Performance Based Budgeting process in even greater depth than in our previous piece, “Performance Based Budgeting, Five Years Later: The Real World Effects of ‘Transparency,”
Works, Vol. 21, No. 7, 7 Nov. 2014. As we will discuss, these outcomes are not accidental by-products of this budgeting system, but are built into it, with significant negative consequences for both faculty and students.
END NOTES
1. Office of Institutional Research, Student Enrollment Reports.
2. Office of Institutional Research, Student Enrollment Reports; Main Campus Faculty Headcount by College.
3. In light of the sensitivity of these issues, faculty members who have provided comments for this article have not been identified.
4. Office of Institutional Research, Main Campus Faculty Headcount by College.
5. Supplemental Schedules to the Annual Financial Audit for the Year Ended June 30, 2009; Annual Fund Accounting Schedules for the Year Ending June 30, 2014.
6. Office of Institutional Research, Student Enrollment Reports; Main Campus Faculty Headcount by College.
7. Ibid.
8. Supplemental Schedules to the Annual Financial Audit for the Year Ended June 30, 2009; Annual Fund Accounting Schedules for the Year Ending June 30, 2014.
9. Office of Institutional Research, Student Enrollment Reports.
10. Office of Institutional Research, Employee Headcount.
